Medical Disclaimer
- For Educational Purposes Only: This content is intended for educational reference and should not be used for clinical decision-making.
- Not a Substitute for Professional Judgment: Always consult your local protocols, institutional guidelines, and supervising physicians.
- Verify Before Acting: Users are responsible for verifying information through authoritative sources before any clinical application.
AI Assistance Notice
The T wave represents ventricular repolarization - the process by which ventricular myocytes restore their resting membrane potential after depolarization. This electrical recovery phase is more heterogeneous and prolonged than depolarization, making T wave morphology exquisitely sensitive to metabolic disturbances, ischemia, and electrolyte abnormalities.
Unlike the QRS complex (which reflects rapid synchronized depolarization), the T wave represents a slower, more variable process influenced by:
- Regional differences in action potential duration - epicardial cells repolarize before endocardial cells
- Autonomic tone - sympathetic stimulation shortens repolarization while vagal tone prolongs it
- Transmembrane ion gradients - particularly potassium, calcium, and magnesium
- Myocardial perfusion and oxygenation - ischemia profoundly alters repolarization
- Structural remodeling - hypertrophy and fibrosis change repolarization sequence
Because repolarization normally proceeds from epicardium to endocardium (opposite to depolarization direction), the T wave is typically concordant with the QRS - meaning it points in the same direction as the dominant QRS deflection. This creates upright T waves in leads with upright QRS complexes.
Normal T waves exhibit several consistent features that help distinguish physiologic from pathologic patterns:
| Characteristic | Normal Finding | Clinical Significance |
|---|---|---|
| Morphology | Asymmetric - gradual upslope with steeper downslope | Creates characteristic rounded appearance |
| Duration | 0.10-0.25 seconds | Longer than QRS, typically 2-3 times QRS duration |
| Amplitude (Limb) | ≤5mm | Higher amplitudes suggest abnormality |
| Amplitude (Precordial) | ≤10mm | Increases V1→V4, then decreases |
| Direction | Concordant with QRS | Same polarity as dominant QRS deflection |
Lead-Specific Normal Variants
- Lead aVR: T wave normally inverted (QRS is also negative)
- Lead V1: T wave may be inverted, flat, or slightly upright in adults
- Lead III: T wave may be inverted, especially with vertical heart axis
- Precordial leads: T wave amplitude increases from V1 to V4, then gradually decreases
- Juvenile T wave pattern: Inverted T waves in V1-V3 can persist into early adulthood (more common in women and Black individuals)
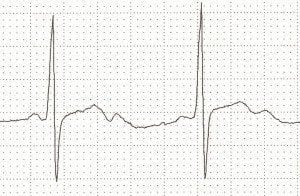
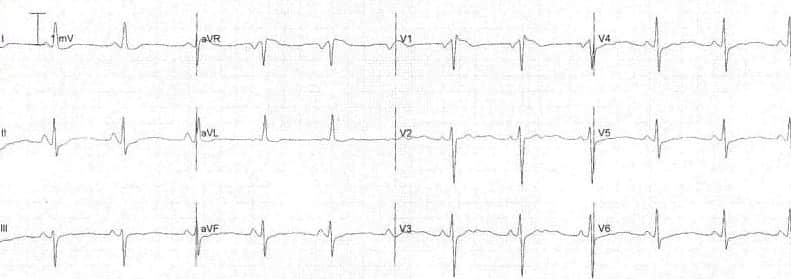
- Normal T waves are asymmetric with a gentle upslope and steeper downslope, typically concordant with the QRS complex
- T wave inversion can indicate ischemia, strain patterns, or be a normal variant in specific leads (aVR, V1, III)
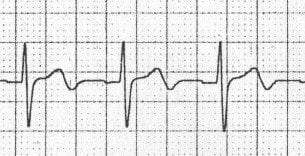
- Hyperacute T waves are tall, broad, and symmetric - an early sign of acute STEMI before ST elevation develops
- Tall peaked T waves suggest hyperkalemia, while flat/inverted T waves may indicate hypokalemia
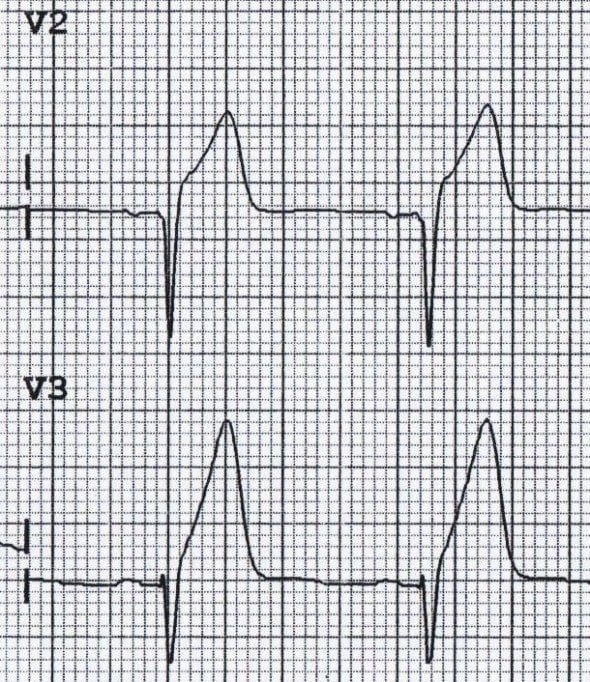
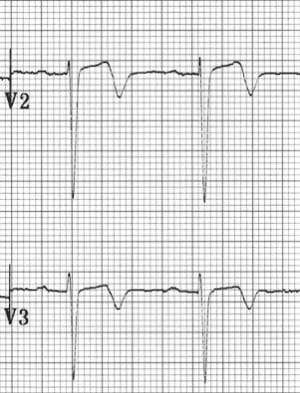
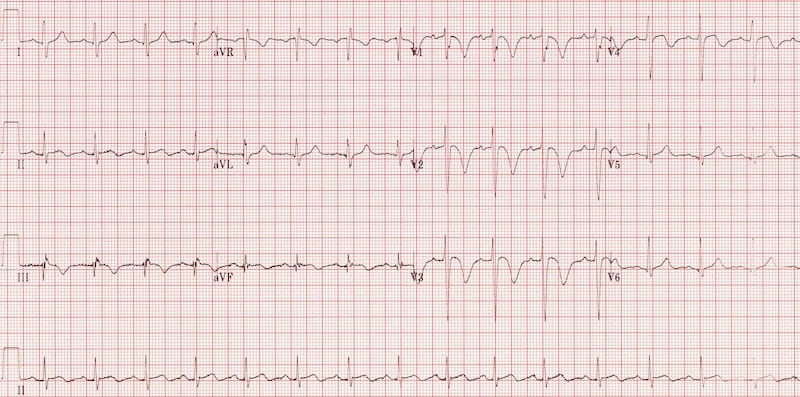
- Wellens syndrome shows biphasic or deeply inverted T waves in V2-V3, indicating critical LAD stenosis
- T wave alternans (beat-to-beat amplitude variation) indicates electrical instability and ventricular arrhythmia risk
Abnormally tall T waves can be physiologic or pathologic, with different morphologic characteristics helping distinguish the etiology:
Hyperacute T Waves (Early STEMI)
- Morphology: Tall, broad-based, and symmetric
- Timing: Earliest ECG sign of acute MI (within minutes), precedes ST elevation
- Distribution: Anatomically localized to region of ischemia
- Associated findings: Loss of R wave amplitude, ST segment straightening
- Clinical significance: Represents acute transmural ischemia requiring immediate intervention
Hyperkalemia
- Morphology: Tall, narrow, peaked (tent-shaped) with narrow base
- Distribution: Diffuse across all leads
- Associated findings: PR prolongation, P wave flattening, QRS widening (as K+ rises)
- Correlation: Severity increases with potassium level (typically >5.5-6.0 mEq/L for ECG changes)
- Clinical significance: Risk of ventricular arrhythmias and cardiac arrest
Other Causes of Tall T Waves
- Left ventricular hypertrophy: Tall T waves in lateral leads (I, aVL, V5-V6)
- Early repolarization: Tall T waves with J-point elevation and notching
- Acute pericarditis: Tall T waves in early stage before widespread ST elevation
- Cerebrovascular accident: Diffuse tall T waves with prolonged QT
- Athletes: Physiologic tall T waves as part of athletic heart syndrome
Hyperacute T waves (ischemia): Broad-based, asymmetric, anatomically localized
Hyperkalemia: Narrow-based (tent-shaped), symmetric, diffuse distribution
Always correlate with clinical context and check potassium levels urgently if unclear.
T wave inversion is one of the most common ECG abnormalities and can represent a spectrum from benign normal variants to life-threatening ischemia:
Ischemic T Wave Inversion
- Morphology: Deep, symmetric inversion (often >5mm)
- Timing: Develops hours to days after acute MI (evolutionary change)
- Distribution: Anatomically localized to territory of affected vessel
- Wellens syndrome: Biphasic or deeply inverted T waves in V2-V3 indicating critical LAD stenosis
- Clinical significance: May indicate non-STEMI, evolving MI, or critical stenosis requiring intervention

Strain Patterns
- Left ventricular strain: Asymmetric T wave inversion with ST depression in lateral leads (I, aVL, V5-V6)
- Right ventricular strain: T wave inversion in right precordial leads (V1-V4) with acute PE or RV pressure overload
- Morphology: Asymmetric with gradual downslope and rapid upslope (opposite of normal)
Cerebral T Waves
- Morphology: Deep, symmetric inversion with prolonged QT interval
- Cause: Subarachnoid hemorrhage, intracerebral hemorrhage, ischemic stroke
- Mechanism: Catecholamine surge causing myocardial injury (neurogenic stunned myocardium)
- Distribution: Often diffuse, particularly in precordial leads
Other Causes of T Wave Inversion
- Bundle branch blocks: Secondary T wave inversion in leads with predominant S wave (appropriate discordance)
- Hypertrophic cardiomyopathy: Deep T wave inversion in lateral and/or inferior leads
- Takotsubo cardiomyopathy: Diffuse T wave inversion with QT prolongation
- Pericarditis (late stage): T wave inversion after ST segments normalize
- Persistent juvenile pattern: Benign T wave inversion in V1-V3 in young adults
- Digoxin effect: Downsloping ST depression with asymmetric T wave inversion (Salvador Dali sign)
• History of recent chest pain (now resolved)
• Minimal or no cardiac enzyme elevation
• Biphasic or deeply inverted T waves in V2-V3
• Preserved R wave progression
• No significant ST elevation or Q waves
Action: Requires urgent cardiology consultation and angiography - 75% will develop extensive anterior MI within weeks if not treated.
T Wave Alternans
Beat-to-beat variation in T wave amplitude, axis, or morphology:
- Microvolt alternans: Requires special equipment to detect, predicts ventricular arrhythmia risk
- Macroscopic alternans: Visible on standard ECG, indicates severe electrical instability
- Causes: Acute ischemia, long QT syndrome, severe electrolyte disturbance, pericardial effusion
- Clinical significance: High risk for ventricular tachycardia/fibrillation - requires immediate intervention
Other Special Patterns
- Bifid (Notched) T Waves: T wave with two peaks or a notch - causes include hypokalemia, LVH, ischemia, hypothermia
- Camelback T Waves: Biphasic T wave morphology - seen in Wellens syndrome, HCM, juvenile pattern, digoxin effect
- Tall T Waves in Athletes: Part of athletic heart syndrome - symmetric and gradual (not hyperacute), no ischemic symptoms
Use this structured approach to systematically evaluate T wave abnormalities:
1. Assess T Wave Direction
- Upright: Normal in most leads (except aVR)
- Inverted: Identify distribution (localized vs. diffuse) and morphology (symmetric vs. asymmetric)
- Biphasic: Consider Wellens syndrome if in V2-V3 with chest pain history
- Flat: Think electrolytes (hypokalemia) or nonspecific abnormality
2. Evaluate T Wave Amplitude
- Tall/Peaked: Measure amplitude and assess morphology (broad vs. narrow base)
- If broad-based and localized: Consider hyperacute T waves of STEMI
- If narrow-based and diffuse: Check potassium for hyperkalemia
- Low amplitude: Assess for hypokalemia, hypothyroidism, pericardial effusion
3. Determine Distribution Pattern
- Anterior (V1-V4): LAD territory, RV strain, PE
- Lateral (I, aVL, V5-V6): Circumflex territory, LV strain/hypertrophy
- Inferior (II, III, aVF): RCA or LCx territory
- Diffuse/Global: Think metabolic (electrolytes), CNS event, myocarditis, PE, Takotsubo
4. Assess Morphology
- Symmetric inversion: Ischemia or cerebral T waves
- Asymmetric inversion: Strain pattern (LVH, RVH), bundle branch blocks
- Hyperacute morphology: Broad-based, tall, symmetric - acute STEMI
- Peaked morphology: Narrow-based, tent-shaped - hyperkalemia
5. Compare to Previous ECGs
- New T wave inversion: Much more concerning than chronic changes
- Pseudonormalization: Previously inverted T waves now upright may indicate acute ischemia
- Evolutionary changes: Progressive T wave inversion after STEMI is expected
Immediate cardiology consultation if:
• New T wave inversions in contiguous leads with chest pain
• Wellens pattern (biphasic or deeply inverted T waves in V2-V3)
• Hyperacute T waves with ischemic symptoms
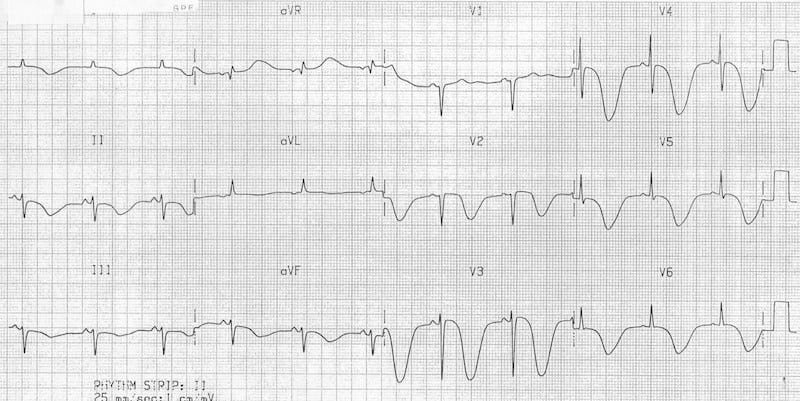
• De Winter pattern (upsloping ST depression + tall T waves)
• T wave alternans (risk of ventricular arrhythmias)
Check electrolytes urgently if:
• Peaked T waves (hyperkalemia screening)
• Flat T waves + prominent U waves (hypokalemia)
• New T wave changes in dialysis patients or with renal failure
- Serial ECGs are crucial: Evolutionary T wave changes (hyperacute → upright → inverted → pseudonormalization) help distinguish acute from old MI
- T wave/QRS ratio: T wave amplitude >2/3 of R wave height suggests hyperacute changes or hyperkalemia
- Lead specificity matters: T wave inversion in aVR is always normal; in V1-V3 may be normal variant; in V2-V4 raises concern for LAD disease
- Pseudonormalization: Previously inverted ischemic T waves becoming upright during acute ischemia - represents reinjury, not improvement
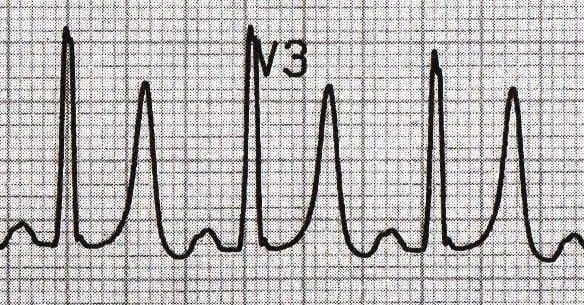
- De Winter T waves: Tall, symmetric T waves in precordial leads with upsloping ST depression at J-point - STEMI equivalent requiring emergent intervention
- Concordance rule: In bundle branch blocks, T waves should be discordant (opposite direction) to QRS; concordant T waves suggest superimposed ischemia
- Memory T waves: Transient T wave inversion after tachycardia resolution, ventricular pacing, or WPW - benign but can mimic ischemia
- Global T wave inversion: If present in most leads (except aVR), think: PE, myocarditis, Takotsubo, or CNS event
Pattern: Upsloping ST depression (≥1mm at J-point) + tall, prominent symmetric T waves in precordial leads
Significance: STEMI equivalent pattern (2% of LAD occlusions) requiring immediate cath lab activation
Key point: These are NOT normal tall T waves - the upsloping ST depression is the critical distinguishing feature
- Farkas, Josh MD. (2015). Table of Contents - EMCrit Project. EMCrit Project. https://emcrit.org/ibcc/toc/
- Khan, M. G. (2007). Rapid ECG Interpretation. Humana.
- Sigg, D. C., Iaizzo, P. A., Xiao, Y.-F., Bin He, & Springerlink (Online Service). (2010). Cardiac Electrophysiology Methods and Models. Springer Us.
- Wang, K. (2012). Atlas of Electrocardiography. JP Medical Ltd.
- ECG Library • LITFL • ECG Library Basics. (2018). Life in the Fast Lane • LITFL • Medical Blog. https://litfl.com/ecg-library/
T wave flattening is a nonspecific finding that can indicate various metabolic, ischemic, or structural abnormalities:
Common Causes
- Hypokalemia: T wave flattening is often the earliest ECG sign, progressing to inversion with prominent U waves
- Ischemia: Subendocardial ischemia can produce flat or minimally inverted T waves (non-STEMI pattern)
- Hypothyroidism: Diffuse low-voltage T waves with bradycardia
- Pericardial effusion: Low voltage QRS and T waves (electrical alternans if large effusion with tamponade)
- Cardiomyopathy: Diffuse T wave flattening in dilated or restrictive cardiomyopathy
- Normal variant: Can be normal in older adults or with increased chest wall thickness
Electrolyte disturbances profoundly affect ventricular repolarization, with characteristic T wave patterns:
| Electrolyte | T Wave Pattern | Additional Findings |
|---|---|---|
| Hyperkalemia | Tall, narrow, peaked (tent-shaped) | PR prolongation, P wave flattening, QRS widening |
| Hypokalemia | Flattened/inverted with prominent U waves | QT prolongation, ST depression |
| Hypercalcemia | Normal/tall T waves | Short QT interval, no ST segment |
| Hypocalcemia | Normal T wave amplitude | Prolonged QT (prolonged ST segment) |
| Hypomagnesemia | Similar to hypokalemia | Often coexists with hypokalemia |