Medical Disclaimer
- For Educational Purposes Only: This content is intended for educational reference and should not be used for clinical decision-making.
- Not a Substitute for Professional Judgment: Always consult your local protocols, institutional guidelines, and supervising physicians.
- Verify Before Acting: Users are responsible for verifying information through authoritative sources before any clinical application.
AI Assistance Notice
What is an R wave? The R wave is the first upward (positive) deflection after the P wave. It represents early ventricular depolarization, specifically the electrical activation of the ventricular muscle.
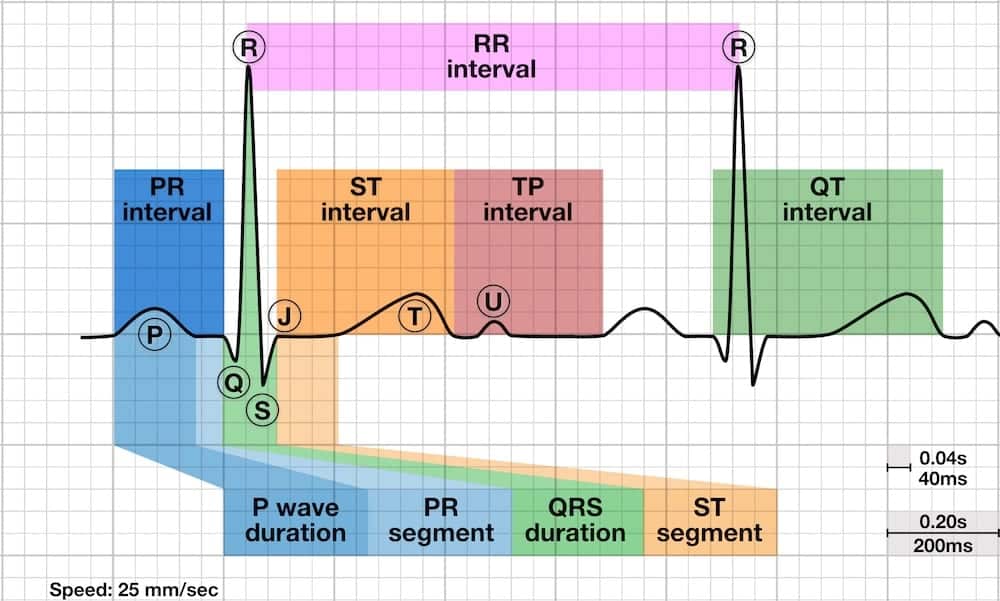
- Normal R wave progression: R wave amplitude increases from V1 to V6 as electrodes "see" more left ventricular mass; V1 shows small r (0-6mm), V3-V4 transition zone (R≥1mm in V3), V5-V6 dominant R (5-26mm)
- Transition zone: Normally V3-V4 where R wave equals S wave (equiphasic); early transition suggests RVH or posterior MI; late transition suggests LVH or anterior MI
- R wave nomenclature: Capital R = large positive deflection; lowercase r = small positive deflection; R' (R-prime) = second positive deflection
- Three key abnormalities: Dominant R in V1 (RVH, RBBB, posterior MI, WPW Type A), dominant R in aVR (toxicity, dextrocardia, VT), poor R wave progression (anterior MI, LVH, lead misplacement)
- Clinical significance: R wave reflects left ventricular mass and depolarization sequence; abnormalities indicate structural heart disease, conduction defects, or prior infarction
The R wave normally increases in amplitude from the right precordial leads (V1) to the left precordial leads (V6). This reflects the progressive "view" of the dominant left ventricular mass as electrodes move from right to left across the chest.
Expected R Wave Amplitude by Lead
| Lead | Normal R Wave Amplitude | Significance |
|---|---|---|
| V1 | 0-6mm (small r wave) | Electrode faces away from left ventricle, toward right ventricle |
| V2 | >0.2mm (typically 0.3-12mm) | Beginning of R wave progression; R should be slightly larger than V1 |
| V3 | ≥1mm (up to 20mm) | Critical threshold; R ≤3mm = poor R wave progression |
| V4 | 1-20mm | Transition zone (R approximately equals S wave) |
| V5 | 5-26mm | Dominant R wave; electrode directly over left ventricle |
| V6 | 5-26mm | Dominant R wave; maximal left ventricular forces |
R Wave Nomenclature
- R: Capital R indicates a large positive deflection (dominant wave in QRS complex)
- r: Lowercase r indicates a small positive deflection (minor component of QRS)
- R': Second positive deflection (R-prime) - seen in bundle branch blocks and some normal variants
- rSR': Small initial r, deep S, tall R' (classic RBBB pattern in V1)
Transition Zone
The transition zone is where the R wave amplitude equals the S wave depth, creating an equiphasic (balanced) QRS complex.
- Normal transition: V3-V4
- Early transition (V1-V2): Suggests RVH, posterior MI, or counterclockwise rotation
- Late transition (V5-V6): Suggests LVH, anterior MI, COPD, or clockwise rotation
R wave amplitude is directly related to ventricular muscle mass. Hypertrophy (thickening) of either ventricle produces characteristic R wave changes.
Left Ventricular Hypertrophy (LVH) Criteria
LVH increases R wave amplitude in left-sided leads and S wave depth in right-sided leads:
- Cornell Voltage Criteria: S wave in V3 + R wave in aVL >28mm (men) or >20mm (women) = LVH likely
- Sokolow-Lyon Criteria: S wave in V1 + R wave in V5 or V6 ≥35mm = LVH ~90% specific (age >30 years; >40mm if age 20-30)
- R wave in aVL: R wave in aVL + S wave ≥24mm (men) or ≥18mm (women) = LVH
- Associated findings: Left axis deviation, ST depression/T wave inversion in V5-V6 (strain pattern), late transition zone
Right Ventricular Hypertrophy (RVH) Criteria
RVH produces tall R waves in right precordial leads (V1-V2) as the hypertrophied right ventricle generates greater electrical forces:
- R wave in V1 ≥7mm
- S wave in V5 or V6 ≥7mm
- R/S ratio in V1 ≥1 (R wave taller than S wave is deep)
- R/S ratio in V5 or V6 <1 (S wave deeper than R wave is tall)
- Right axis deviation ≥+110°
Causes of RVH
- Chronic pulmonary disease: COPD, pulmonary fibrosis
- Pulmonary hypertension: Primary or secondary
- Pulmonary embolism: Acute massive PE can produce acute RV strain
- Congenital heart defects: Tetralogy of Fallot, pulmonary stenosis, ASD, VSD with left-to-right shunt
- Tricuspid or pulmonary valve disease
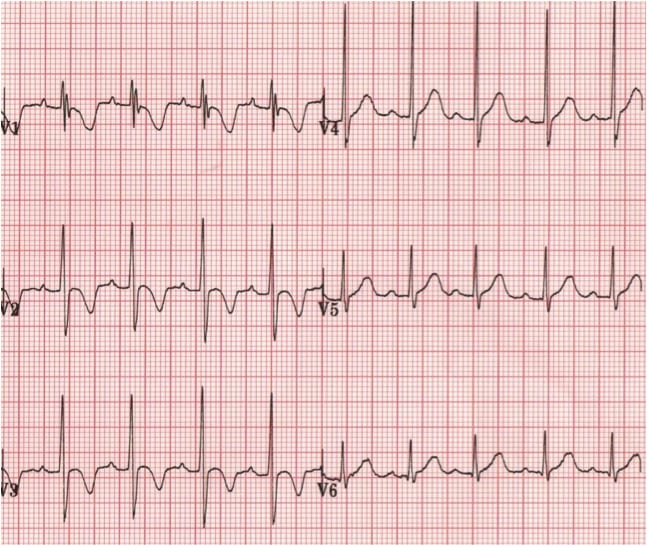
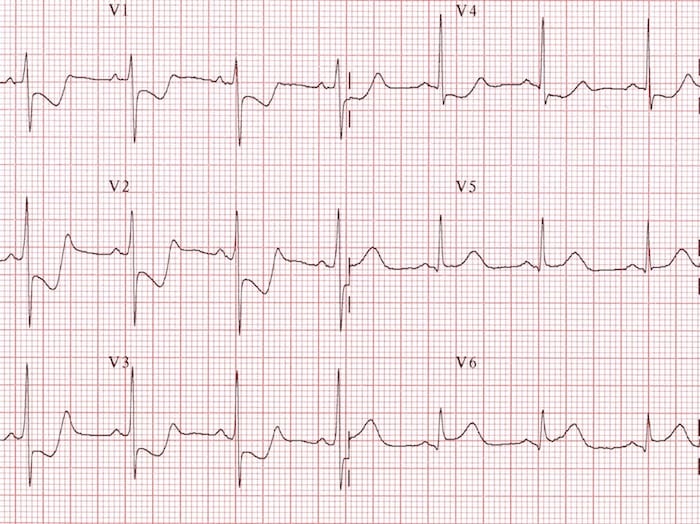
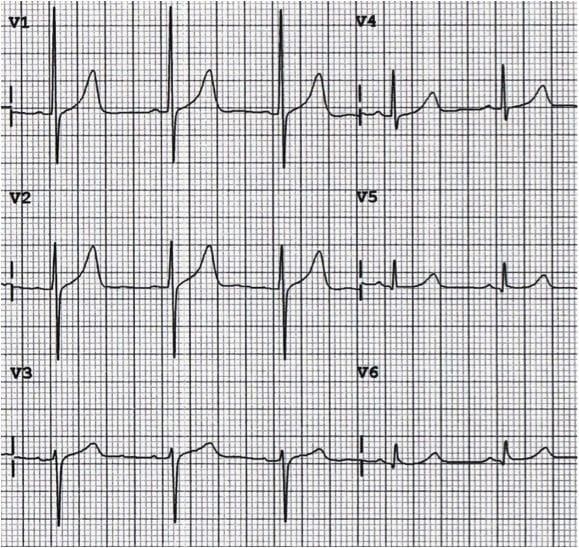
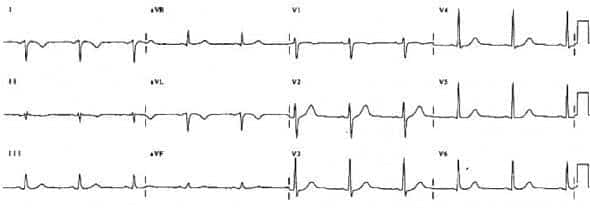
A dominant R wave in V1 (where R wave is taller than S wave depth) is abnormal in adults and suggests several possible diagnoses.
Causes of Dominant R Wave in V1
| Cause | Key Features |
|---|---|
| Normal Variant | Normal in children and young adults; infantile pattern persistence |
| Right Ventricular Hypertrophy (RVH) | Tall R in V1, right axis deviation; causes: PE, pulmonary HTN, left-to-right shunt |
| Right Bundle Branch Block (RBBB) | rSR' pattern ("rabbit ears") in V1; QRS ≥0.12 sec; wide S in I, V6 |
| Posterior MI | Tall R in V1-V2; ST elevation in V7-V9; often with inferior MI |
| WPW Type A | Tall R in V1; short PR interval; delta wave; pre-excitation pattern |
| Incorrect Lead Placement | V1 and V3 reversed; biphasic P wave in "V3" is clue |
| Dextrocardia | Reversed precordial progression; dominant R in aVR; inverted P in I |
| Hypertrophic Cardiomyopathy | Increased left ventricular mass; may show tall R in V1-V2 |
| Muscular Dystrophy | Myotonic dystrophy, Duchenne muscular dystrophy |
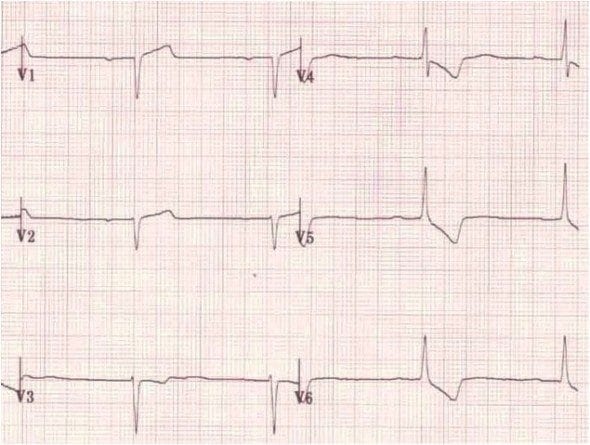
ECG Examples: Dominant R Wave in V1
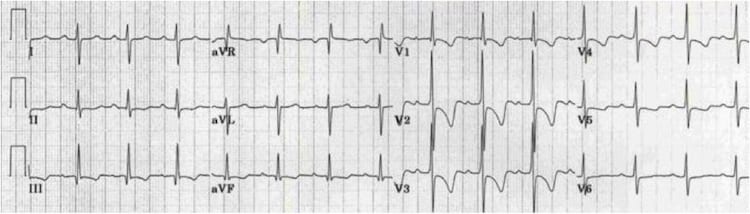
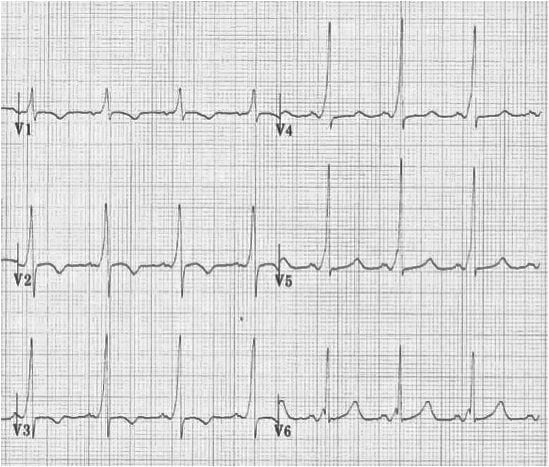
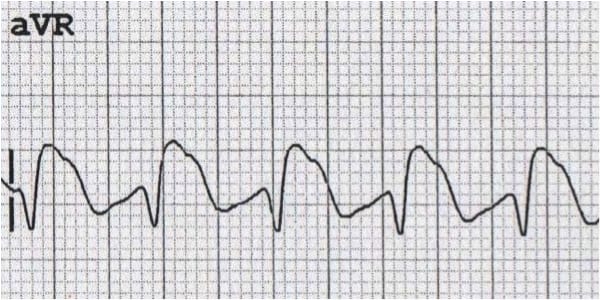
Lead aVR normally shows a predominantly negative QRS complex. A dominant (positive) R wave in aVR is abnormal and has important diagnostic implications.
Causes of Dominant R Wave in aVR
- Sodium-channel blocking drug poisoning: TCAs, antiarrhythmics (Class Ia, Ic)
- Dextrocardia: Heart positioned on right side of chest
- Incorrect lead placement: Left and right arm leads reversed (most common cause)
- Ventricular tachycardia: Commonly shows elevated R in aVR
ECG Examples: Dominant R Wave in aVR
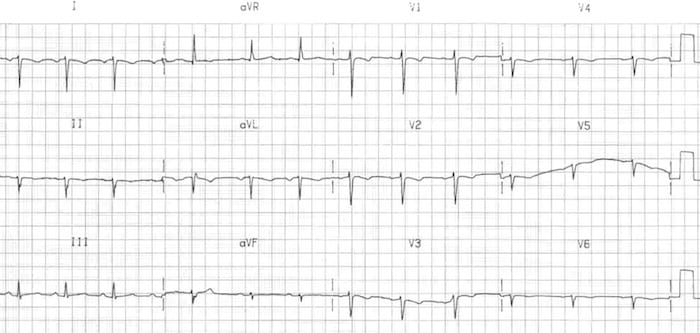
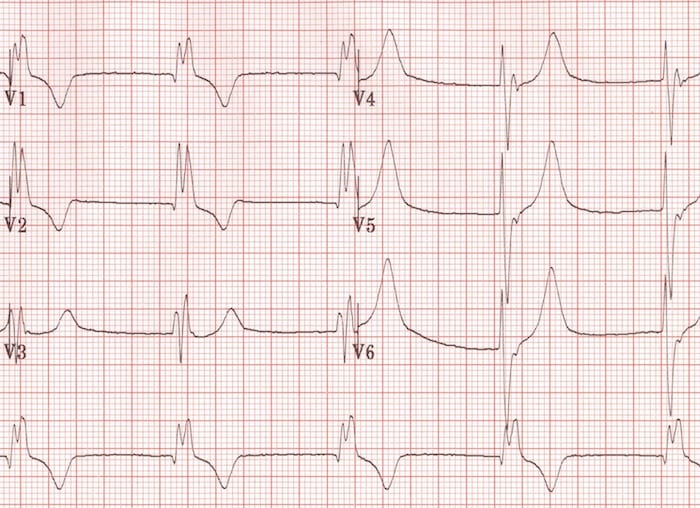
Definition: Poor R wave progression (PRWP) is defined as R wave ≤3mm in lead V3. It indicates failure of the R wave to increase normally from V1 to V6.
Causes of Poor R Wave Progression
| Cause | Clinical Context |
|---|---|
| Prior Anteroseptal MI | Most important pathologic cause; look for Q waves and ST-T abnormalities |
| Left Ventricular Hypertrophy (LVH) | Increased left ventricular mass shifts transition zone; LVH voltage criteria present |
| Incorrect Lead Placement | V1-V2 placed too high on chest wall; most common technical cause |
| Normal Variant | Not uncommon in young women and thin individuals; clinical correlation required |
| Left Bundle Branch Block (LBBB) | QRS ≥0.12 sec; abnormal septal activation; absent septal Q waves |
| Chronic Lung Disease (COPD/Emphysema) | P pulmonale, low voltage, small R waves throughout; increased lung air trapping |
| Clockwise Rotation | Heart rotated clockwise on long axis; late transition zone (V5-V6) |
| Left Anterior Fascicular Block | Left axis deviation with qR pattern in lateral leads |
| Cardiomyopathy | Dilated or infiltrative cardiomyopathy affecting anterior wall |
Normal transition (R=S) occurs in V3-V4. Early transition (V1-V2) suggests RVH, posterior MI, or counterclockwise heart rotation. Late transition (V5-V6) suggests LVH, COPD, anterior MI, or clockwise rotation. Think of heart rotation as the descriptive term for these shifts.
A dominant R wave in V1 is NEVER normal in adults (but IS normal in children due to relative RV dominance). The differential includes RVH, RBBB, posterior MI, WPW Type A, dextrocardia, and lead misplacement. Always investigate the cause - don't accept it as a "variant."
A dominant R wave in aVR >3mm or R/S ratio >0.7 strongly suggests sodium channel blocker toxicity (tricyclic antidepressants, Class Ia/Ic antiarrhythmics). This is a critical finding in overdose evaluation and should prompt immediate toxicology consult and sodium bicarbonate consideration.
The most frequent cause of dominant R in aVR is left/right arm lead reversal (technical error). Check for other features: inverted lead I, switched aVR/aVL positions, but normal precordial R wave progression (unlike dextrocardia which shows reversed precordial progression). When aVR looks weird, verify lead placement before diagnosing pathology.
Poor R wave progression is common and usually a normal variant in young women and thin individuals. However, ALWAYS exclude anterior MI with clinical correlation, comparison to old ECGs, and assessment for pathologic Q waves or ST-T abnormalities. Context is everything.
Posterior MI presents as tall R waves in V1-V2 (reciprocal change from posterior ST elevation), often coexisting with inferior MI (ST elevation II, III, aVF). Don't miss it - check posterior leads (V7-V9) for diagnostic ST elevation ≥0.5mm. Posterior MI requires same urgent reperfusion therapy as anterior MI.
The normal increase in R wave amplitude from V1 to V6 directly reflects the progressive "view" of the large left ventricular muscle mass. Anything disrupting this sequence (MI scar, LBBB, COPD hyperinflation, lead misplacement) will alter R wave progression. The R wave is your window into left ventricular anatomy.
V1/V3 reversal produces biphasic P wave in "V3" (normally only seen in V1). V1-V2 placed too high on chest produces false poor R wave progression. RA/LA reversal shows inverted lead I with dominant R in aVR. Always verify technical accuracy before diagnosing structural pathology - "trust but verify."
Loss of R waves (pathologic Q waves) in anterior leads with isoelectric ST segments indicates OLD anterior MI (>6 weeks). Loss of R waves WITH ST elevation indicates ACUTE or RECENT anterior MI requiring immediate cath lab activation. ST segments provide the timeline.
In normal adults, V1 shows a small r wave and deep S wave (R/S ratio <1). When R/S ratio in V1 ≥1 (R taller than S is deep), suspect RVH. Combine with right axis deviation, R wave in V1 ≥7mm, and right ventricular strain pattern for confident RVH diagnosis. Context: pulmonary disease, congenital defects, PE.
Systematic R Wave Assessment
- Assess R wave progression V1→V6: Should increase progressively. R ≤3mm in V3 = poor R wave progression (PRWP)
- Identify transition zone: Where R=S. Normal = V3-V4. Early (V1-V2) or late (V5-V6) transition requires explanation
- Check for dominant R in V1: If R>S in V1, consider RVH, RBBB (look for rSR'), posterior MI (check II/III/aVF), WPW Type A (short PR, delta wave), lead misplacement
- Evaluate aVR: Should be predominantly negative. If dominant R in aVR, check for lead reversal (most common), sodium channel blocker toxicity (R>3mm), VT, or dextrocardia
- Calculate voltage for LVH: S in V1 + R in V5/V6 ≥35mm (if no BBB and age >30). Check for strain pattern (ST depression/T inversion in V5-V6)
- Correlate clinically: PRWP in young woman with normal echo = likely normal. Tall R in V1 with dyspnea and right axis deviation = suspect RVH from pulmonary disease
Common Pitfalls to Avoid
Key Differentials
| Finding | Key Differentials | Discriminating Features |
|---|---|---|
| Tall R in V1 | RVH, RBBB, Posterior MI, WPW Type A | RVH: RAD, strain; RBBB: rSR', wide QRS; Post MI: inferior STE; WPW: short PR, delta wave |
| PRWP | Anterior MI, LVH, LBBB, Normal variant | MI: pathologic Qs, ST-T changes; LVH: high voltage; LBBB: wide QRS, no septal q; Normal: young women, thin build |
| Dominant R in aVR | Lead reversal, TCA toxicity, VT, Dextrocardia | Reversal: inverted I, normal V leads; Toxicity: wide QRS, history; VT: AV dissociation; Dextro: reversed V progression |
| Late transition | LVH, Anterior MI, COPD, Clockwise rotation | LVH: high voltage, strain; MI: Qs, ST-T changes; COPD: low voltage, RAD, P pulmonale |
When to Worry
- New PRWP with chest pain: Acute anterior MI until proven otherwise - activate cath lab if ST elevation present
- Dominant R in aVR >3mm with altered mental status: Sodium channel blocker toxicity - give sodium bicarbonate, contact poison control
- Tall R in V1-V2 with inferior STEMI: Posterior wall involvement - reperfusion urgency increased, check posterior leads
- New tall R in V1 with dyspnea and hypoxia: Consider acute RV strain from massive PE - check troponin, BNP, echo, CT angiography
- Farkas, Josh MD. (2015). Table of Contents - EMCrit Project. EMCrit Project. https://emcrit.org/ibcc/toc/
- Khan, M. G. (2007). Rapid ECG Interpretation. Humana.
- Sigg, D. C., Iaizzo, P. A., Xiao, Y.-F., Bin He, & Springerlink (Online Service). (2010). Cardiac Electrophysiology Methods and Models. Springer Us.
- Wang, K. (2012). Atlas of Electrocardiography. JP Medical Ltd.
- ECG Library • LITFL • ECG Library Basics. (2018). Life in the Fast Lane • LITFL • Medical Blog. https://litfl.com/ecg-library/