Medical Disclaimer
- For Educational Purposes Only: This content is intended for educational reference and should not be used for clinical decision-making.
- Not a Substitute for Professional Judgment: Always consult your local protocols, institutional guidelines, and supervising physicians.
- Verify Before Acting: Users are responsible for verifying information through authoritative sources before any clinical application.
AI Assistance Notice
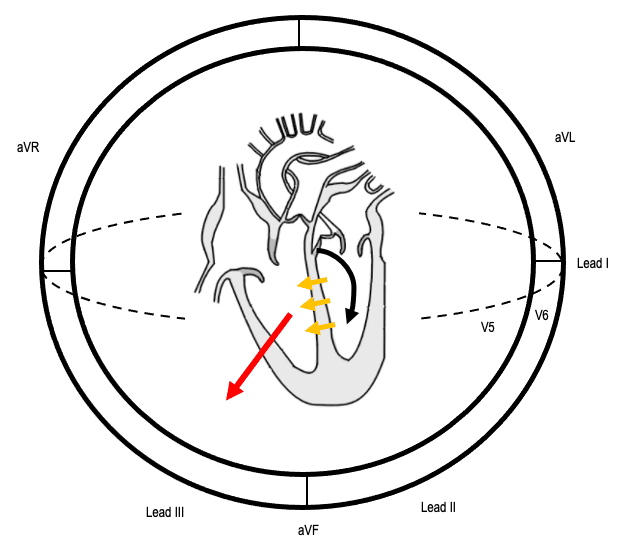
The QRS complex represents ventricular depolarization - the rapid electrical activation of the left and right ventricular myocardium. It is the most prominent waveform on the ECG and reflects the spread of electrical impulse through the ventricular conduction system (bundle branches and Purkinje fibers) and the ventricular muscle mass.
Understanding QRS morphology is essential for interpreting:
- Conduction system integrity: Bundle branch blocks, fascicular blocks, accessory pathways
- Chamber abnormalities: Ventricular hypertrophy (LVH, RVH)
- Prior myocardial injury: Pathologic Q waves indicating old infarction
- Rhythm origin: Supraventricular (narrow QRS) vs ventricular (wide QRS)
- Metabolic/toxic effects: Hyperkalemia, sodium channel blockers, antiarrhythmics
QRS Nomenclature
Individual QRS components are labeled by specific conventions:
- Q wave: First negative (downward) deflection
- R wave: First positive (upward) deflection
- S wave: Negative deflection following an R wave
- Capital vs lowercase: Capital letters (Q, R, S) denote large deflections; lowercase (q, r, s) denote small deflections
- R' (R-prime): Second positive deflection (as in rSR' pattern)
- QS complex: Entirely negative deflection with no R wave
- qRs: small q, large R, small s
- rSR': small r, large S, large R' (classic RBBB in V1)
- QS: entirely negative, no R wave (seen in anterior MI or V1 normally)

Normal QRS Measurements
| Parameter | Normal Range | Clinical Significance |
|---|---|---|
| Duration | <0.12 seconds (3 small boxes) | ≥0.12 sec = wide QRS (bundle branch block, ventricular rhythm, drug effect) |
| R wave amplitude (V5-V6) | 5-26 mm | Tall R waves may indicate LVH; low voltage (<5 mm) suggests pericardial effusion, COPD, obesity |
| R wave progression | R wave increases V1→V6; transition zone V3-V4 | Poor R wave progression suggests anterior MI; early transition can indicate RVH or posterior MI |
| Q wave (physiologic) | <0.04 sec wide, <25% R wave height | Pathologic Q waves (wide/deep) indicate prior transmural MI |
Normal QRS Morphology by Lead
- V1 (right precordial): Predominantly negative (rS or QS); small r reflects septal depolarization left→right
- V2: Similar to V1, often with deeper S wave
- V3-V4 (transition zone): R and S waves approximately equal (equiphasic); marks electrical "transition" from right to left
- V5-V6 (left precordial): Predominantly positive (qR or R); reflects dominant left ventricular mass
- Limb leads: Variable based on cardiac axis; typically upright in I and II in normal axis
Bundle branch blocks occur when conduction is delayed or blocked in the left or right bundle branch, causing sequential rather than simultaneous ventricular activation. This produces a wide QRS (≥0.12 seconds) with characteristic morphology patterns.
Right Bundle Branch Block (RBBB)
Pathophysiology: Right ventricle depolarizes late (after left ventricle), via slow cell-to-cell conduction.
ECG Criteria:
- QRS duration ≥0.12 seconds
- V1-V2: rSR' pattern ("M-shaped" or "rabbit ears") - terminal R' represents delayed RV activation
- I, aVL, V5-V6: Wide, slurred S wave (represents late RV depolarization moving away from lateral leads)
- ST-T changes: Discordant (opposite direction to terminal QRS) - normal finding in RBBB
Common causes:
- Normal variant (especially in athletes, young patients)
- Right ventricular strain (PE, pulmonary hypertension, cor pulmonale)
- Structural heart disease (cardiomyopathy, congenital defects)
- Ischemic heart disease
- Degenerative conduction system disease (Lenegre-Lev disease)
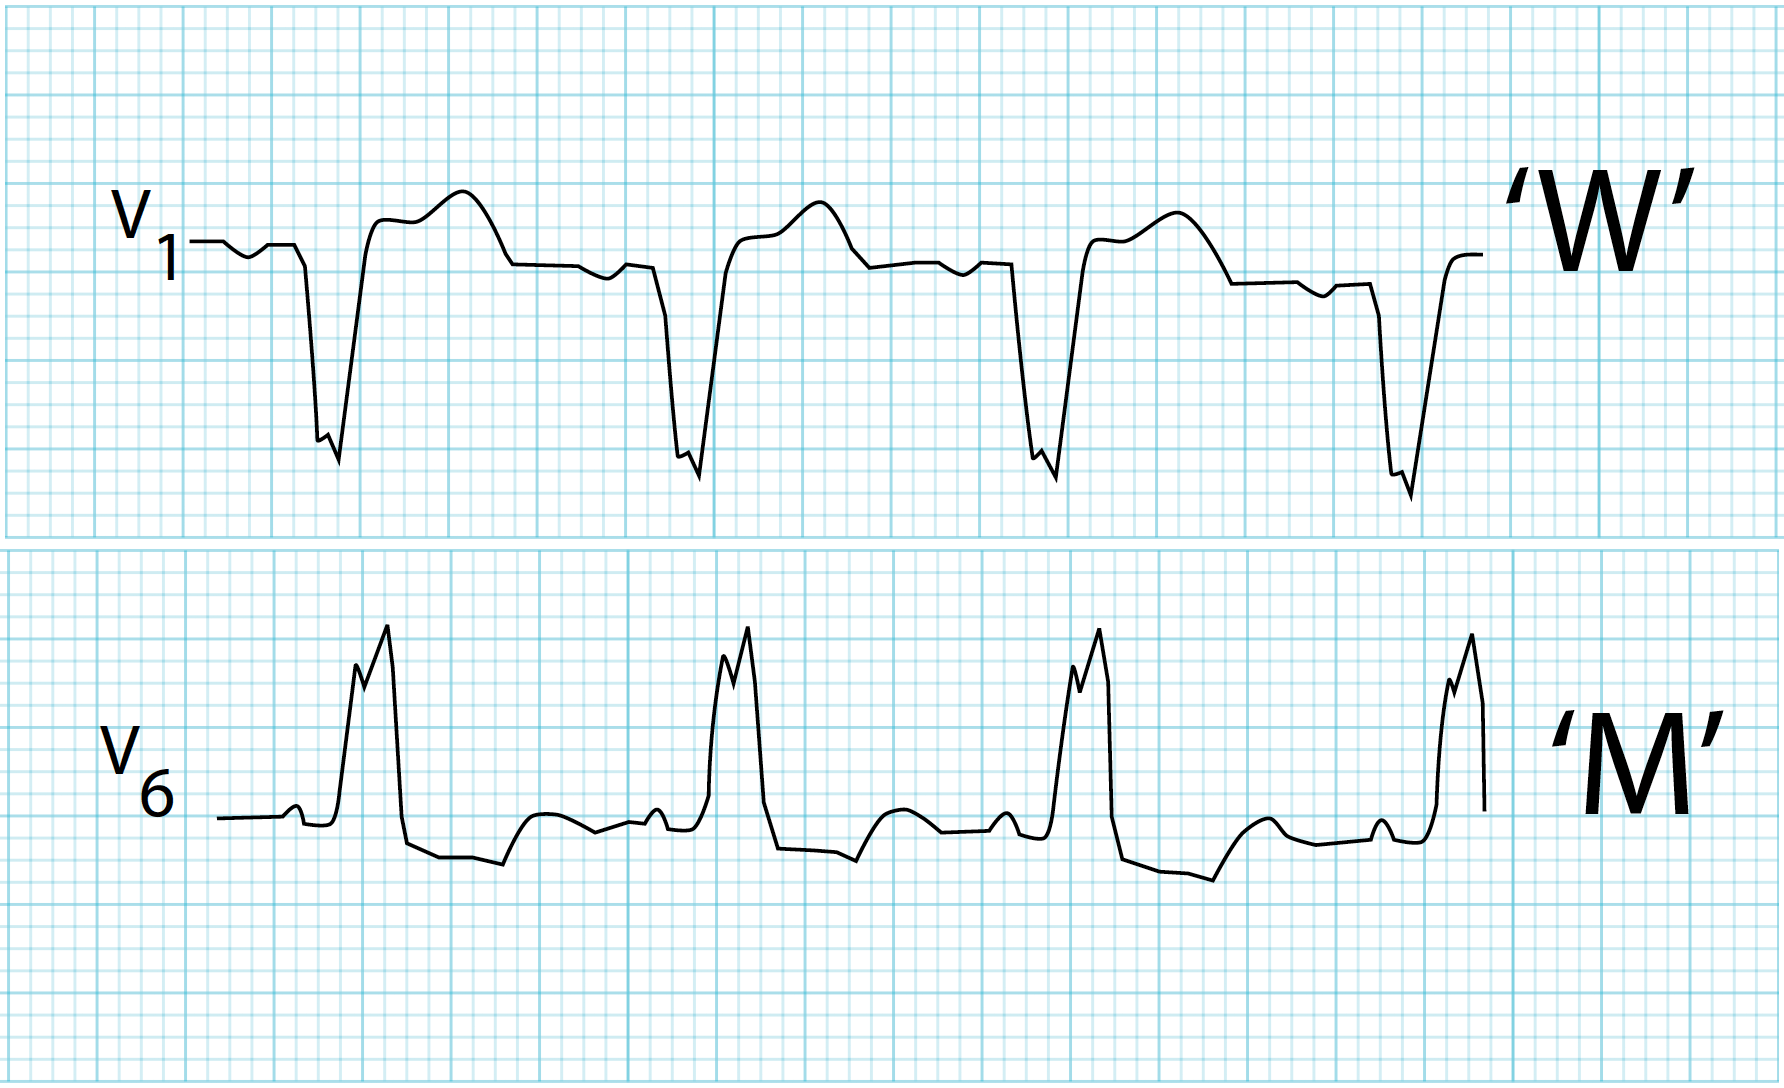
- WiLLiaM: LBBB has W in V1, M in V6
- MaRRoW: RBBB has M in V1, W in V6

Left Bundle Branch Block (LBBB)
Pathophysiology: Left ventricle depolarizes late via slow cell-to-cell conduction from right ventricle, altering normal septal depolarization.
ECG Criteria:
- QRS duration ≥0.12 seconds
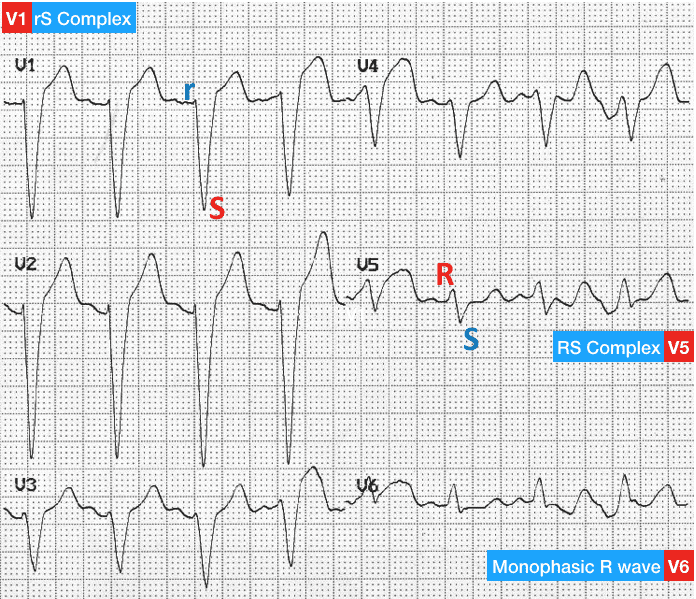
- V5-V6, I, aVL: Broad, monophasic R wave (often notched or "M-shaped") - no q wave
- V1-V2: Deep QS or rS complex
- Absent septal Q waves: No small q in lateral leads (I, aVL, V5-V6) because septal depolarization is reversed
- ST-T changes: Discordant (ST depression/T inversion in leads with tall R; ST elevation in leads with deep S)
Common causes:
- Ischemic heart disease (most common)
- Hypertensive heart disease / LVH
- Cardiomyopathy (dilated, hypertrophic)
- Aortic valve disease (stenosis, regurgitation)
- Degenerative conduction system disease
Incomplete Bundle Branch Block
- Definition: QRS duration 0.10-0.119 seconds with typical RBBB or LBBB morphology
- Significance: Represents partial conduction delay; may progress to complete block
- IRBBB: Very common, often benign in young patients
- ILBBB: Less common; consider similar causes as complete LBBB
- Normal QRS duration: <0.12 seconds (less than 3 small boxes)
- QRS represents: Ventricular depolarization - the electrical activation of both ventricles
- Wide QRS (≥0.12 sec): Think bundle branch block, ventricular pacing, hyperkalemia, drugs (TCA, antiarrhythmics), ventricular tachycardia
- RBBB pattern: rSR' in V1 (M-shaped or "rabbit ears"), wide S in I and V6
- LBBB pattern: Broad monophasic R in I, aVL, V5-V6; no septal Q waves; ST-T discordance
- Q waves: Small physiologic q waves are normal; pathologic Q waves (≥0.04 sec wide or >25% R wave height) suggest prior MI
- Key pearl: QRS morphology reveals conduction system integrity, chamber hypertrophy, and prior infarction patterns
- Farkas, Josh MD. (2015). Table of Contents - EMCrit Project. EMCrit Project. https://emcrit.org/ibcc/toc/
- Khan, M. G. (2007). Rapid ECG Interpretation. Humana.
- Sigg, D. C., Iaizzo, P. A., Xiao, Y.-F., Bin He, & Springerlink (Online Service). (2010). Cardiac Electrophysiology Methods and Models. Springer Us.
- Wang, K. (2012). Atlas of Electrocardiography. JP Medical Ltd.
- ECG Library • LITFL • ECG Library Basics. (2018). Life in the Fast Lane • LITFL • Medical Blog. https://litfl.com/ecg-library/