Medical Disclaimer
- For Educational Purposes Only: This content is intended for educational reference and should not be used for clinical decision-making.
- Not a Substitute for Professional Judgment: Always consult your local protocols, institutional guidelines, and supervising physicians.
- Verify Before Acting: Users are responsible for verifying information through authoritative sources before any clinical application.
AI Assistance Notice
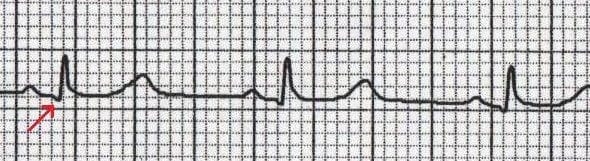
What is a Q wave? Any downward (negative) deflection that comes before an R wave. Q waves represent the normal electrical activation of the wall between the left and right ventricles (the interventricular septum).
- Timing: Abnormal Q waves from heart muscle death occur 2-24 hours after heart attack onset, always with ST elevation
- Pathologic Criteria: Q wave ≥0.04 seconds (1 small box) wide, OR >2mm deep, OR ≥25% depth of R wave suggests infarction
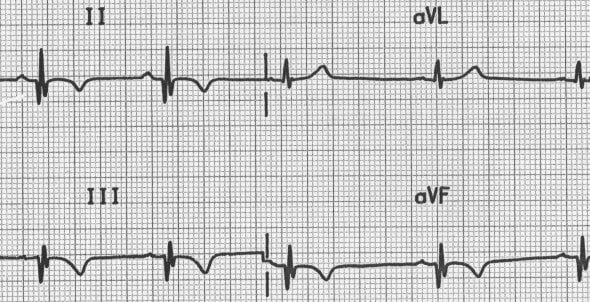
- Lead III Caution: Most incorrect MI diagnoses come from non-diagnostic Q waves in III and aVF—lead III is the most unreliable
- R Wave Progression: Expected normal R wave: V1 0-6mm, V2 >0.2mm, V3 ≥1mm
- Q Wave Evolution: >80% persist 4-5 years post-MI; ~10% become non-diagnostic; ~10% disappear; ~5% ECG returns to normal
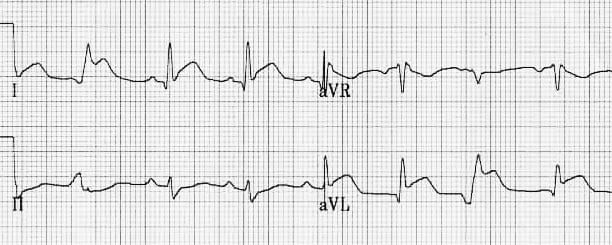
- Normal Septal Q Waves: Small Q waves are typically seen in left-sided leads (I, aVL, V5, V6). Under normal circumstances, Q waves should NOT be seen in right-sided leads (V1-3)
Small, narrow Q waves are normal in many leads. The depth of the Q wave is not as important as the width.
| Lead(s) | Normal Q Wave Criteria | Key Points |
|---|---|---|
| Lead III | ≤0.04 second, <10 mm deep | Narrow Q may occur as normal finding; must not be accompanied by abnormal Q waves in II and aVF |
| Lead aVL | <0.04 second; up to 7 mm deep (>30 years); up to 10 mm deep (children) | Negative P + QS or QR + negative T may be normal in vertical heart |
| Leads II, aVF | ≤0.03 second, <4 mm deep | Small, narrow Q waves may occur; if borderline width, interpret as "inferior Qs noted; clinical correlation required; borderline ECG" |
| Lead I | ≤1.5 mm deep (adults >30 years) | Depth should not exceed 1.5 mm |
| V4, V5, V6 | ≤0.03 second; <3 mm (adults >40 years); <4 mm (adults <30 years) | Small q in V6 ≤0.03 sec present in >75% of normal individuals; normal Q waves <3 mm in adults >40 years |
| V2-V4 | Generally absent or minute | Q >0.03 sec and >2 mm deep in V2-V4 is abnormal if V1 shows initial R and no significant shift of transitional zone |
Timing and Evolution
- Abnormal Q waves from myocardial necrosis occur as early as 2 hours and as late as 24 hours after onset of clinical symptoms
- Q waves of acute infarction are always associated with abnormal ST elevation
- From 6-12 hours after symptom onset, ST elevation recedes but Q waves become more prominent
Diagnostic Criteria
Q Wave Evolution Over Time
- >80%: Pathologic Q waves persist 4-5 years after acute MI
- ~10%: Q waves become nondiagnostic but still suspicious
- ~10%: Q waves disappear
- ~5%: ECG returns to normal in patients with Q wave infarction
Pathological Q Wave Criteria (LITFL)
Q waves are considered pathological if they meet ANY of these criteria:
- Width: > 40 milliseconds (1 small box / 0.04 seconds) wide
- Depth: > 2mm deep
- Proportion: > 25% of the depth of the QRS complex
- Location: Seen in leads V1-3 (normally Q waves should NOT appear in right-sided leads)
Note: Location determined from ECG findings is not always precise, particularly for anterolateral, anteroseptal, and posterior infarctions.
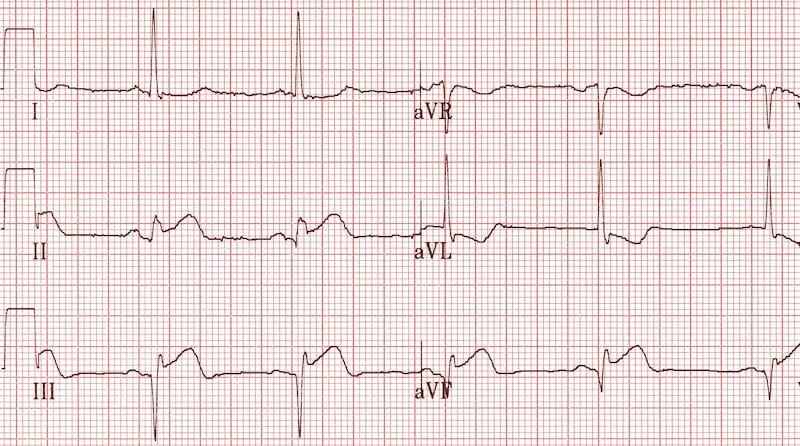
Inferior Infarction (Bottom Wall)
- Q waves: Abnormal Q waves in leads II, III, and aVF
- Width criteria: Q waves in II, III, aVF >0.03 second; Q in lead III >0.04 second
- Acute: ST elevation in II, III, aVF; more specific if you see mirror-image ST depression in I, aVL, V1, V2 during early hours
- Old: Abnormal Q waves with non-specific ST-T changes in II, III, aVF; lead III most unreliable
- Specificity: Q >0.03 sec in leads II and aVF: 96% specificity, ~50% sensitivity
Anterior Infarction (Front Wall)
- Q waves: Abnormal Q, QS, or QR waves in V2-V4 or V5, or V1-V6 with extensive anterior infarction
- Acute: ST elevation in V2-V4 or V5; mirror-image ST depression may develop in II, III, aVF during early hours
- Old: Abnormal Q waves, QS complexes in V2-V4 or V5; ST usually flat but some abnormality often remains
Anteroseptal or Anteroapical Infarction (Front Wall Near Septum or Apex)
- Q waves: Abnormal Q waves, QS pattern in V1-V3
- Acute: ST elevation in V1-V3 in patients with acute chest pain
- Important: Recent ultrasound and angiography studies showed 92% of patients with ST elevation in V1-V3 (traditionally called "anteroseptal MI") actually had damage to the tip of the heart (apex) with normal septum
Anterolateral Infarction (Front and Side Wall)
- Q waves: Abnormal Q waves in V5, V6, I, aVL (less specific)
- Pattern often reflects: Damage to tip of heart; may also be found in scarring of the septum and thickened heart muscle disease
- Specificity: QS pattern in V4 makes diagnosis more reliable
Right Ventricular Infarction (Right Side of Heart)
- Usually occurs together with inferior infarction
- Diagnostic ECG: ST elevation in V4R and V3R along with ST elevation and developing Q waves in II, III, aVF
- Important timing: ST elevation in V4R goes away within 8 hours of symptom onset—check early!
Posterior Infarction (Back Wall)
- True posterior infarction often occurs with inferior MI
- V1: R wave taller than S wave, R/S ratio >1; T wave (often negative elsewhere) is upright and may be tall; R wave should be >0.04 second
- V2: R wave is tall, normally positive T wave may be tall and peaked
- More reliable if: ST elevated in V7-V9 when ECG also shows acute inferior infarction
Differential Diagnosis: Other conditions that can cause pathological-appearing Q waves without actual infarction:
- Myocarditis (heart muscle inflammation, including Chagas disease and AIDS) may cause abnormal Q waves
- Hypertrophic Cardiomyopathy: Thickened heart muscle disease can cause abnormal Q waves (deep, wide Q waves in II, III, aVF, and V4-V6)
- Infiltrative heart disease: Conditions where abnormal substances deposit in heart muscle (amyloidosis, sarcoidosis)
- Wolff-Parkinson-White Syndrome: Extra electrical pathway creates false Q waves in II, III, aVF that may look like inferior MI (look for short PR interval and delta wave)
- Left Ventricular Hypertrophy (LVH): QS pattern may occur in V1, V2, or V3 and look like MI
- Heart Rotation: Extreme clockwise or counter-clockwise rotation can create unusual Q wave patterns
- Lead Placement Errors: Incorrect electrode placement (e.g., arm leads on legs) can create false Q waves
The absence of small septal Q waves in leads V5-6 should be considered abnormal.
Other causes of absent Q waves in V5-6:
- Left Bundle Branch Block (LBBB): Most common cause
- Left Ventricular Hypertrophy: Thickened heart muscle can mask normal Q waves
- Pre-excitation (WPW): Abnormal early activation pathway changes normal pattern
Most incorrect diagnoses of infarction are made based on findings of non-diagnostic Q waves in leads III and aVF. Lead III is the most unreliable lead—always verify with leads II and aVF.
Poor R wave progression in V2-V3 is not uncommon in females and may look like old anteroseptal MI. Be careful with lead placement of V1 and V2 in both females and males.
When severe COPD/emphysema shows poor R wave progression or Q waves that look like infarction, tall pointed P waves (P pulmonale: P wave >2.5mm in II, III, or aVF) support the diagnosis of COPD causing the pattern rather than true MI.
92% of patients with ST elevation in V1-V3 (traditionally called "anteroseptal MI") actually had damage to the tip of the heart (apex) with normal septum on ultrasound/angiography.
ST elevation in V4R (diagnostic of right ventricle infarction) goes away within 8 hours of symptom onset. Get right-sided leads early if you suspect RV involvement.
The depth of the Q wave is not as important as the width. Focus on duration ≥0.04 seconds (1 small box) as the primary abnormal finding.
Step-by-Step Approach to Q Wave Analysis
- Measure Q wave width: Is it ≥0.04 seconds (1 small box)? Width is more important than depth
- Check adjacent leads: Are ≥2 neighboring leads involved?
- Look for ST elevation: Q waves of acute MI are ALWAYS with ST elevation
- Look for mirror-image changes: ST depression in opposite leads makes diagnosis more reliable in acute phase
- Lead III needs special attention: Is the Q only in lead III, or does it also appear in II/aVF?
- Check for poor R wave progression: Is this actually anteroseptal MI or something else (wrong lead placement, COPD, LBBB, LVH, late transition, normal variant)?
- Rule out mimics: WPW (false Q waves), thickened heart muscle, heart inflammation, LVH (QS in V1-V3)
- Compare with old ECGs: When available, determine if Q waves are new or old; look for changes over time
- Clinical correlation: Always combine ECG with symptoms, cardiac blood tests (troponin), and imaging
When to Report "Borderline" or "Clinical Correlation Required"
- Q waves in II, III, aVF with borderline width—especially if only in lead III
- Poor R wave progression without clear ST-T abnormalities
- Q waves when confusing factors present (LBBB, LVH, wrong lead placement)
- Old Q waves with ongoing ST-T abnormalities but no information on when MI occurred (report as "infarction age cannot be determined")
Common Mistakes to Avoid
- Over-reading lead III: Remember, lead III is the least reliable lead; always check II and aVF
- Ignoring lead placement error: Especially important when evaluating poor R wave progression in women
- Missing normal patterns: Very small R waves in V1-V3 in young women; early transition that looks like posterior MI
- Forgetting the timeline: Q waves develop and change over time; ST elevation should be present in acute phase; compare with old ECGs when possible
- Not checking for tall P waves: Supports COPD diagnosis when poor R progression present
- Farkas, Josh MD. (2015). Table of Contents - EMCrit Project. EMCrit Project. https://emcrit.org/ibcc/toc/
- Khan, M. G. (2007). Rapid ECG Interpretation. Humana.
- Sigg, D. C., Iaizzo, P. A., Xiao, Y.-F., Bin He, & Springerlink (Online Service). (2010). Cardiac Electrophysiology Methods and Models. Springer Us.
- Wang, K. (2012). Atlas of Electrocardiography. JP Medical Ltd.
- ECG Library • LITFL • ECG Library Basics. (2018). Life in the Fast Lane • LITFL • Medical Blog. https://litfl.com/ecg-library/
Most incorrect diagnoses of infarction are made based on findings of non-diagnostic Q waves in leads III and aVF. Lead III is the most unreliable lead—always verify with leads II and aVF.
Poor R wave progression in V2-V3 is not uncommon in females and may look like old anteroseptal MI. Be careful with lead placement of V1 and V2 in both females and males.
When severe COPD/emphysema shows poor R wave progression or Q waves that look like infarction, tall pointed P waves (P pulmonale: P wave >2.5mm in II, III, or aVF) support the diagnosis of COPD causing the pattern rather than true MI.
92% of patients with ST elevation in V1-V3 (traditionally called "anteroseptal MI") actually had damage to the tip of the heart (apex) with normal septum on ultrasound/angiography.
ST elevation in V4R (diagnostic of right ventricle infarction) goes away within 8 hours of symptom onset. Get right-sided leads early if you suspect RV involvement.
The depth of the Q wave is not as important as the width. Focus on duration ≥0.04 seconds (1 small box) as the primary abnormal finding.