Medical Disclaimer
- For Educational Purposes Only: This content is intended for educational reference and should not be used for clinical decision-making.
- Not a Substitute for Professional Judgment: Always consult your local protocols, institutional guidelines, and supervising physicians.
- Verify Before Acting: Users are responsible for verifying information through authoritative sources before any clinical application.
AI Assistance Notice
What is the PR Segment?
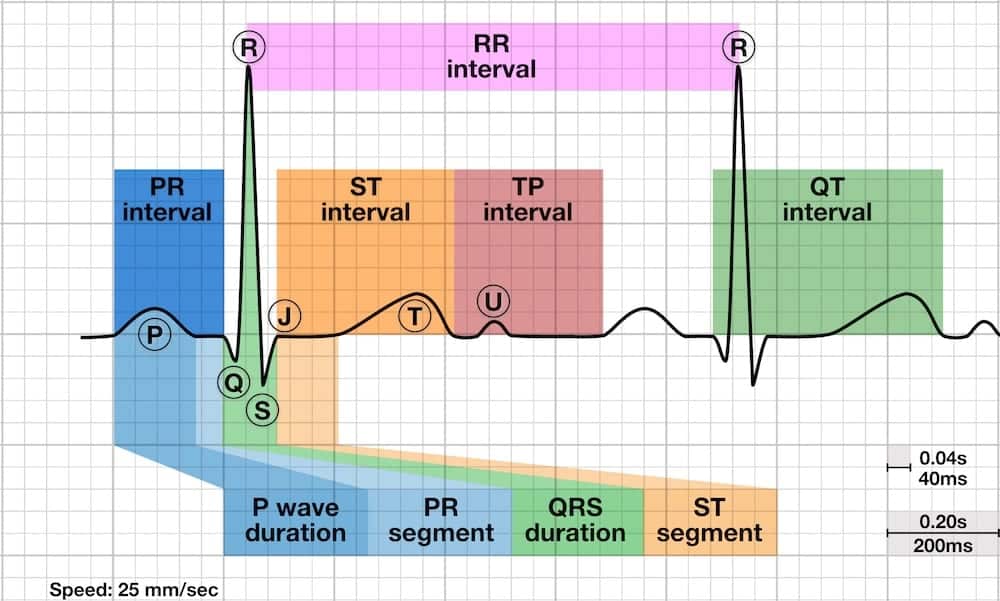
The PR segment is the flat (isoelectric) portion of the ECG tracing between the end of the P wave and the beginning of the QRS complex. It represents the delay as the electrical impulse passes through the AV node, bundle of His, and bundle branches before ventricular depolarization begins.
Physiologic Significance
- Represents: Conduction through the AV node and His-Purkinje system (silent electrical activity with no associated myocardial depolarization visible on surface ECG)
- Normal appearance: Isoelectric (flat) - at the same baseline level as the TP segment
- Duration: Variable, depending on heart rate and AV conduction velocity (not independently measured - it's included in the PR interval)
- Clinical importance: Deviations from baseline (depression or elevation) indicate pathologic atrial or pericardial processes
PR Segment vs. PR Interval
- PR Interval = P wave onset → QRS onset (includes P wave + PR segment)
- PR Segment = P wave end → QRS onset (only the isoelectric portion)
Identifying the Normal PR Segment
- Location: From the end of the P wave (return to baseline after atrial depolarization) to the start of the QRS complex
- Expected morphology: Flat, isoelectric line at the same level as the TP segment (baseline)
- Best leads to evaluate: Limb leads (II, III, aVF, aVR) where atrial activity is most prominent
- Normal variation: May be difficult to visualize if the PR interval is very short or if the P wave blends into the QRS
How to Measure PR Segment Deviation
- Establish the baseline: Use the TP segment (end of T wave to start of next P wave) as your reference isoelectric line
- Identify the PR segment: Locate the flat portion between P wave end and QRS start
- Compare levels: Determine if the PR segment is above (elevated), below (depressed), or at the same level as the TP baseline
- Measure deviation: Typically described qualitatively (present/absent) rather than quantitatively, but can be measured in millimeters if needed
Definition & Recognition
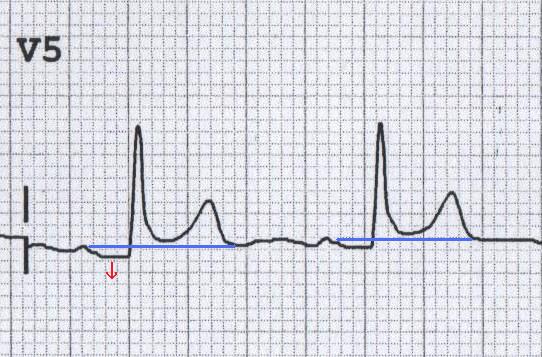
PR segment depression occurs when the PR segment falls below the isoelectric baseline (TP segment level). This is a subtle but important ECG finding associated with atrial injury patterns.
Causes of PR Segment Depression
| Condition | Mechanism | Associated ECG Findings |
|---|---|---|
| Acute Pericarditis | Atrial epicardial injury current | Diffuse ST elevation (concave), PR depression in limb & precordial leads, PR elevation in aVR |
| Atrial Infarction | Ischemia/injury to atrial myocardium | May see atrial arrhythmias, changes in P wave morphology, associated ventricular MI |
| Atrial Injury (trauma, post-operative) | Direct atrial tissue damage | Variable; may see atrial arrhythmias |
Acute Pericarditis - The Classic Presentation
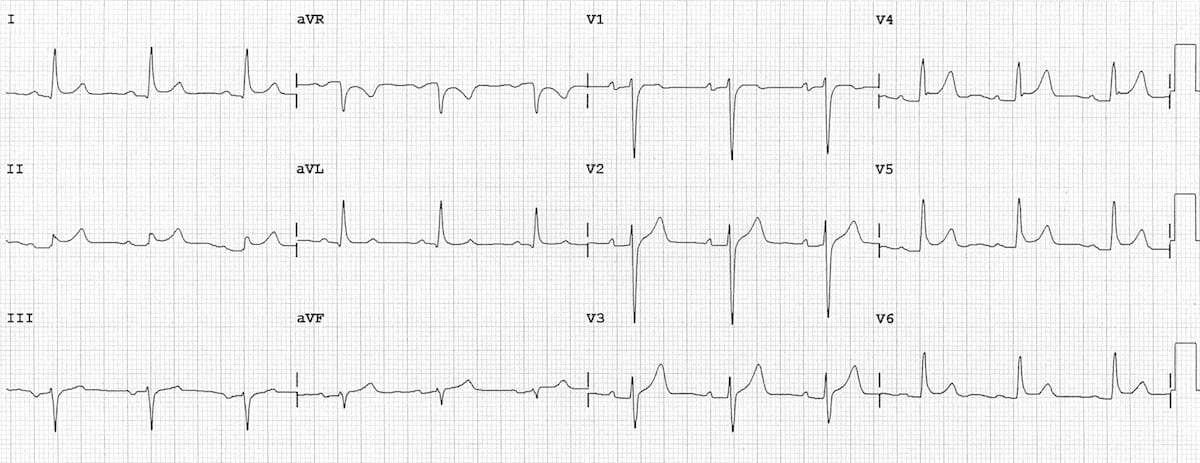
PR segment depression is one of the most specific ECG findings for acute pericarditis, though it's only present in 60-80% of cases.
ECG Features of Acute Pericarditis
- Stage 1 (first hours to days):
- Widespread ST elevation (concave upward "smiley face" morphology)
- PR segment depression in most leads (especially II, V5-V6)
- PR segment elevation in aVR (reciprocal change)
- Stage 2 (days): ST segments and PR segments normalize
- Stage 3 (weeks): T wave inversion develops
- Stage 4 (weeks to months): ECG returns to normal (or T waves remain inverted)
Differentiating Pericarditis from STEMI
| Feature | Pericarditis | STEMI |
|---|---|---|
| ST elevation distribution | Diffuse, widespread (multiple territories) | Regional (confined to coronary artery distribution) |
| ST morphology | Concave upward ("smiley face") | Convex upward or horizontal |
| Reciprocal ST depression | Usually absent (except aVR, V1) | Present in reciprocal leads |
| PR segment | Depressed (except aVR - elevated) | Normal (isoelectric) |
| Q waves | Absent | May develop with transmural infarction |
| T wave inversion timing | After ST normalization (days to weeks) | Early (hours to days) |
Atrial Infarction
- Incidence: Occurs in ~10-17% of ventricular MIs but often underrecognized
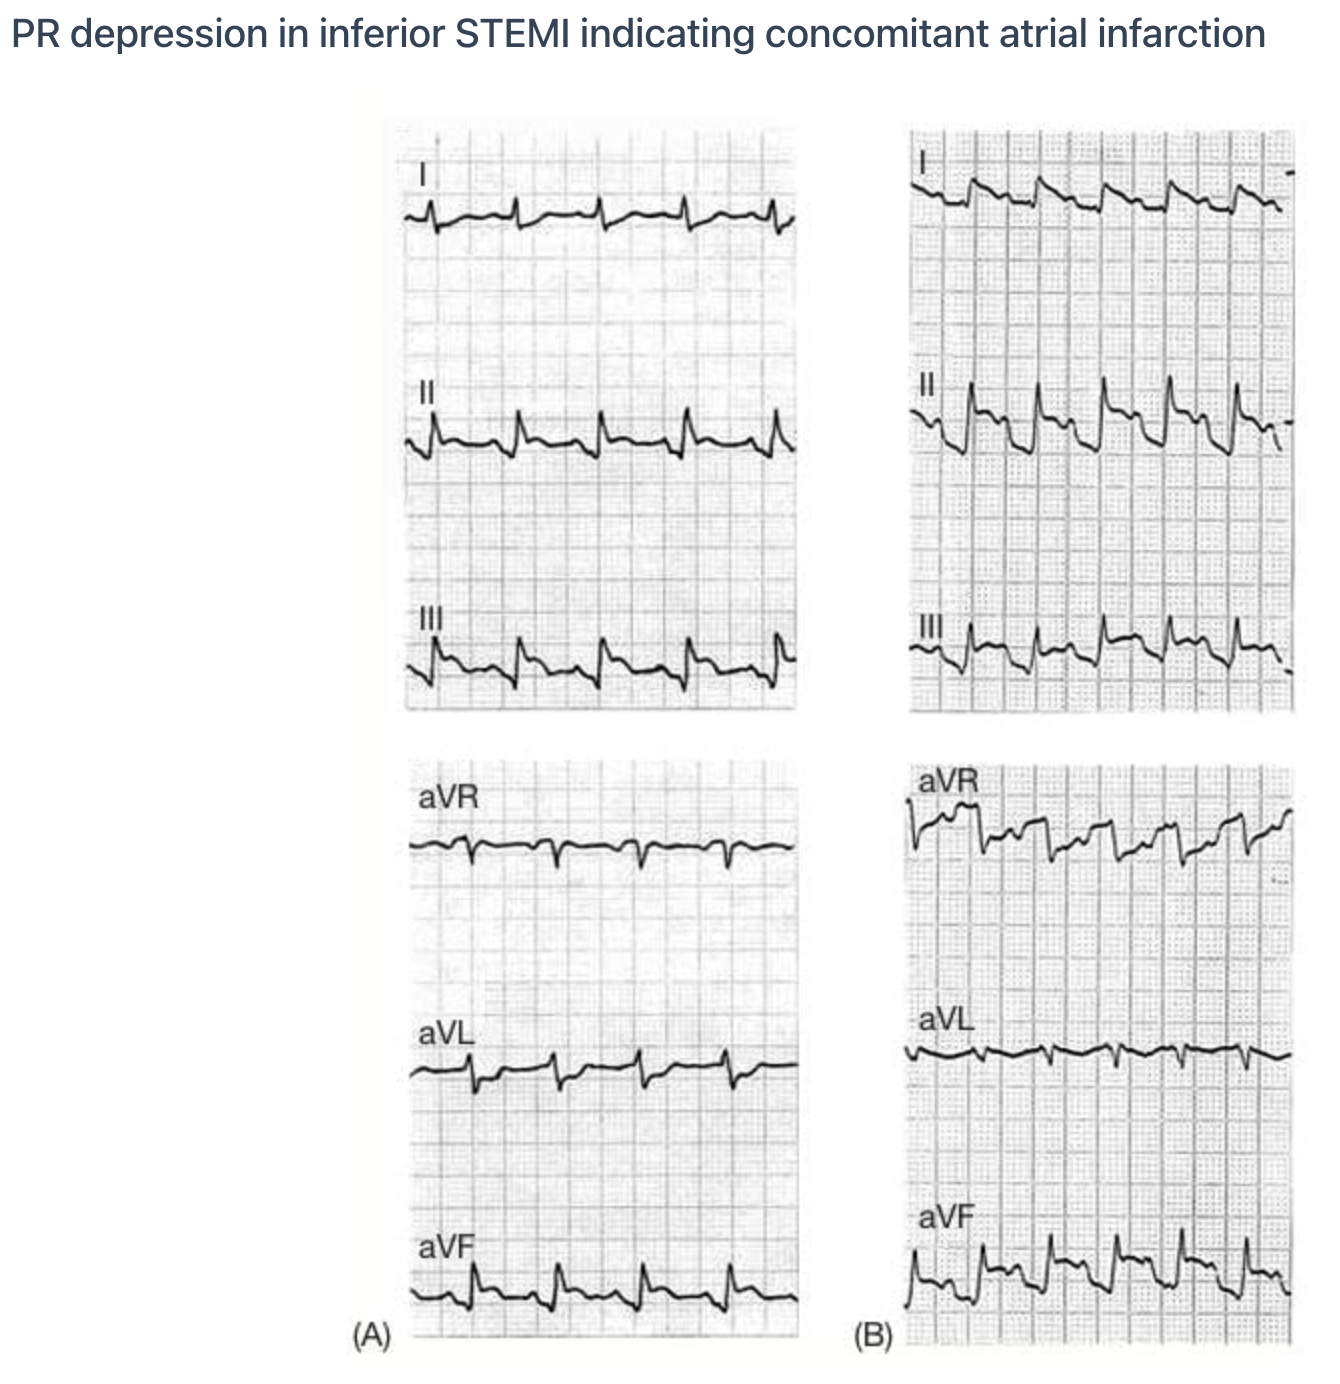
- Most common with: Inferior or posterior MI (right coronary artery occlusion affecting atrial branches)
- ECG findings:
- PR segment depression (atrial injury current)
- PR segment elevation in leads V1-V3 or aVR (reciprocal)
- Abnormal P wave morphology or duration
- Atrial arrhythmias (AFib, atrial flutter, atrial tachycardia)
- Clinical significance: Associated with increased risk of atrial arrhythmias, heart failure, and thromboembolic complications
Definition & Recognition
PR segment elevation occurs when the PR segment rises above the isoelectric baseline. This is less common than PR depression and is typically seen as a reciprocal change.
Causes & Context
| Lead(s) with PR Elevation | Interpretation | Associated Findings |
|---|---|---|
| aVR | Reciprocal to diffuse PR depression (pericarditis) | PR depression in other leads, diffuse ST elevation |
| V1-V3 | Possible right atrial injury or reciprocal to left atrial injury | May see atrial arrhythmias, concurrent MI |
| Isolated aVR elevation | Normal variant or technical artifact | None; clinically insignificant if isolated |
Lead aVR: The Reciprocal Lead
- In pericarditis: While most leads show PR depression, aVR typically shows PR elevation (reciprocal change)
- Sensitivity/specificity: PR elevation in aVR combined with PR depression in other leads strongly suggests pericarditis
- Why aVR? Lead aVR views the heart from the right shoulder, opposite the left ventricular apex; electrical changes appear inverted
Step-by-Step Approach
- Identify the baseline: Use the TP segment as your isoelectric reference point
- Locate the PR segment: Find the flat portion between the end of the P wave and the start of the QRS
- Compare levels: Is the PR segment above, below, or at the same level as the TP baseline?
- Check multiple leads: PR segment deviations should be present in multiple leads (diffuse pattern suggests pericarditis; regional pattern may suggest atrial infarction)
- Look for associated findings: ST changes, T wave abnormalities, P wave morphology changes
- Correlate clinically: Chest pain? Pericardial rub? Fever? Recent MI? Context is critical
Common Pitfalls to Avoid
- Confusing PR interval with PR segment: The interval includes the P wave; the segment does not
- Using the wrong baseline: Don't use the ST segment or T wave as baseline; use the TP segment
- Overlooking subtle changes: PR depression can be very subtle (0.5-1 mm); compare carefully with the TP segment
- Ignoring tachycardia: Fast heart rates obscure the TP segment and make PR assessment difficult
- Forgetting lead aVR: Always check aVR for reciprocal PR elevation in suspected pericarditis
- Farkas, Josh MD. (2015). Table of Contents - EMCrit Project. EMCrit Project. https://emcrit.org/ibcc/toc/
- Khan, M. G. (2007). Rapid ECG Interpretation. Humana.
- Sigg, D. C., Iaizzo, P. A., Xiao, Y.-F., Bin He, & Springerlink (Online Service). (2010). Cardiac Electrophysiology Methods and Models. Springer Us.
- Wang, K. (2012). Atlas of Electrocardiography. JP Medical Ltd.
- ECG Library • LITFL • ECG Library Basics. (2018). Life in the Fast Lane • LITFL • Medical Blog. https://litfl.com/ecg-library/