Medical Disclaimer
- For Educational Purposes Only: This content is intended for educational reference and should not be used for clinical decision-making.
- Not a Substitute for Professional Judgment: Always consult your local protocols, institutional guidelines, and supervising physicians.
- Verify Before Acting: Users are responsible for verifying information through authoritative sources before any clinical application.
AI Assistance Notice
The P wave represents atrial depolarization - the electrical activation of both atria. In normal sinus rhythm, the impulse originates from the sinoatrial (SA) node in the high right atrium and spreads through the atrial myocardium to reach the AV node.
Understanding P wave morphology is fundamental to rhythm interpretation. The shape, size, and direction of the P wave in different leads reveals:
- Origin of impulse: Sinus node, ectopic atrial focus, or AV junction
- Atrial chamber abnormalities: Enlargement or hypertrophy
- Conduction pathways: Normal interatrial conduction or abnormal patterns
- Rhythm classification: Supraventricular vs ventricular
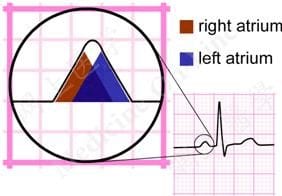
The Atrial Waveform - Understanding P Wave Formation
Atrial depolarization proceeds sequentially from right to left:
- The right atrium is activated before the left atrium
- The first 1/3 of the P wave corresponds to right atrial activation
- The final 1/3 corresponds to left atrial activation
- The middle 1/3 is a combination of both atrial waveforms
In most leads (e.g., lead II), the right and left atrial waveforms move in the same direction, forming a monophasic P wave. However, in lead V1, the waveforms move in opposite directions, producing a biphasic P wave with:
- Initial positive deflection = right atrial activation
- Subsequent negative deflection = left atrial activation
Sinus P Wave Criteria
- Upright in leads I, II, and aVF: Indicates depolarization traveling inferiorly and leftward from SA node
- Inverted in aVR: As impulse travels away from right shoulder
- Variable in III, aVL: Depending on heart axis
- Biphasic in V1: Initial positive deflection (right atrium) followed by negative (left atrium)
- Upright in V2-V6: Anterior and leftward spread
P Wave Axis
- Normal P wave axis: 0° to +75°
- Clinical significance: P wave axis outside this range suggests an ectopic atrial rhythm (impulse not originating from SA node)
- Quick check: P wave should be upright in leads I and II, inverted in aVR
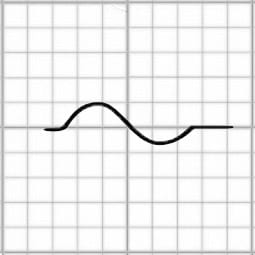
Morphology Patterns
- Smooth contour: Normal P waves have a rounded, smooth appearance
- Monophasic in lead II: Single positive deflection
- Biphasic in V1: Initial positive (RA) + terminal negative (LA) deflections of similar size
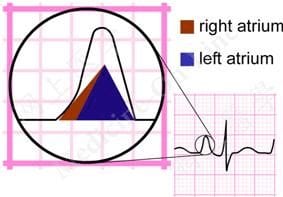
Right Atrial Enlargement (P Pulmonale)
In right atrial enlargement, right atrial depolarization lasts longer than normal and its waveform extends to the end of left atrial depolarization. Although the amplitude of the right atrial current remains unchanged, its peak now falls on top of the left atrial wave, producing a taller P wave while width remains normal.
- Lead II/III/aVF criteria: P wave amplitude >2.5 mm (tall, peaked)
- Lead V1 criteria: Increased height (>1.5 mm) of the initial positive deflection
- Duration: Remains normal (<0.12 seconds)
- Mechanism: Increased right atrial muscle mass and delayed RA depolarization
- Morphology: Tall, peaked, "Gothic arch" P waves best seen in inferior leads
Common causes:
- Pulmonary hypertension (any cause)
- Chronic obstructive pulmonary disease (COPD)
- Cor pulmonale
- Pulmonary embolism (acute or chronic)
- Tricuspid stenosis or regurgitation
- Pulmonary stenosis
- Congenital heart disease with right-sided volume/pressure overload
Identifying Ectopic Atrial Activity
When the P wave doesn't match normal sinus morphology, consider an ectopic atrial rhythm:
| P Wave Finding | Rhythm Interpretation |
|---|---|
| Inverted P in II, III, aVF; upright in aVR | Low atrial or junctional rhythm (retrograde atrial activation) |
| Varying P wave morphology (≥3 forms) | Multifocal atrial tachycardia (MAT) or wandering atrial pacemaker |
| Sawtooth flutter waves | Atrial flutter (typically 2:1, 3:1, or variable block) |
| Irregular, chaotic baseline without discrete P waves | Atrial fibrillation |
| No P waves, narrow QRS | Junctional rhythm or atrial fibrillation with controlled rate |
| P waves following QRS (retrograde) | Junctional tachycardia or AVNRT |
Premature Atrial Complexes (PACs)
- P wave morphology: Different from sinus P waves; shape depends on ectopic focus location
- Timing: Occurs earlier than expected sinus P
- PR interval: May be shorter, normal, or longer than sinus PR; very premature PACs may not conduct (blocked PAC)
- QRS: Typically narrow and identical to sinus beats; aberrantly conducted PACs can be wide
- Normal P wave duration: <0.12 seconds (less than 3 small boxes)
- Normal P wave amplitude: <2.5 mm in limb leads
- Normal sinus P wave: Upright in leads I, II, aVF; inverted in aVR
- P wave represents: Atrial depolarization from SA node through atrial myocardium
- First half: Right atrial activation
- Second half: Left atrial activation
- Key pearl: P wave morphology tells you where the impulse originated
- Farkas, Josh MD. (2015). Table of Contents - EMCrit Project. EMCrit Project. https://emcrit.org/ibcc/toc/
- Khan, M. G. (2007). Rapid ECG Interpretation. Humana.
- Sigg, D. C., Iaizzo, P. A., Xiao, Y.-F., Bin He, & Springerlink (Online Service). (2010). Cardiac Electrophysiology Methods and Models. Springer Us.
- Wang, K. (2012). Atlas of Electrocardiography. JP Medical Ltd.
- ECG Library • LITFL • ECG Library Basics. (2018). Life in the Fast Lane • LITFL • Medical Blog. https://litfl.com/ecg-library/