Medical Disclaimer
- For Educational Purposes Only: This content is intended for educational reference and should not be used for clinical decision-making.
- Not a Substitute for Professional Judgment: Always consult your local protocols, institutional guidelines, and supervising physicians.
- Accuracy Not Guaranteed: While all content has been prepared to the best of my knowledge and ability, errors or omissions may exist.
- Verify Before Acting: Users are responsible for verifying information through authoritative sources before any clinical application.
AI Assistance Notice
Bedside Topline (What to Think About First)
- Hemodynamics = Pump (heart) + Tank (volume) + Pipes (vascular tone/resistance) + Oxygen delivery (DO₂)
- Always interpret numbers in context: waveform quality → measured pressures → derived variables → clinical picture
- Level/zero at the phlebostatic axis and read invasive pressures at end-expiration
- For Swan-Ganz: confirm position by waveform (RA → RV → PA → PAOP) and use the smallest wedge time and volume (≤1.5 mL)
- Patterns of CVP, PAOP, CI, and SVR are more useful than any single number when classifying shock and choosing fluids vs pressors vs inotropes
Core Concepts & Normal Hemodynamic Values
Keep a simple mental model: the heart is a pump, the intravascular volume is the tank, and the vascular tone is the pipes. Hemodynamic monitoring tells you which component has failed and how aggressively to intervene.
| Variable | What it represents | Normal range (adult) | Pearls |
|---|---|---|---|
| MAP | Organ perfusion pressure | 65–90 mmHg | Approx = (SBP + 2×DBP) / 3. Aim ≥65 mmHg in most shock states. |
| CVP / RAP | Right-sided preload | 2–6 mmHg | Trend over time with same transducer level; sensitive to PEEP, RV function, intrathoracic pressure. |
| PAP (s/d/m) | Pulmonary artery pressure | 15–25 / 8–15 / ~15 mmHg | Elevated in pulmonary HTN, left-sided failure, or high PEEP; check PVR pattern. |
| PAOP / PAWP | Estimated LV end-diastolic pressure (LVEDP) | 8–12 mmHg | Use end-expiratory wedge; unreliable in ARDS, high PEEP, mitral disease, or pulmonary veno-occlusive disease. |
| CO | Total forward flow | 4–8 L/min | CO = HR × SV. Thermodilution assumes stable rhythm and no significant TR. |
| CI | CO indexed to BSA | 2.5–4.0 L/min/m² | Better than raw CO in extremes of body size; most shock protocols use CI cutoffs. |
| SVR | Systemic vascular resistance | 800–1200 dyn·s/cm⁵ | SVR = (MAP – CVP) / CO × 80. High in hypovolemic/cardiogenic shock; low in distributive shock. |
| PVR | Pulmonary vascular resistance | 50–250 dyn·s/cm⁵ | PVR = (mPAP – PAOP) / CO × 80. High in PE, ARDS, hypoxic pulmonary vasoconstriction, pulmonary HTN. |
| SvO₂ / ScvO₂ | Balance of DO₂ vs VO₂ | SvO₂ 65–75%; ScvO₂ 70–80% | Low = extraction ↑ (low DO₂ or high demand); very high with shock suggests extraction failure (e.g., late septic shock). |
Invasive Lines & Transducer Fundamentals
Transducers, Leveling and Damping
- Transducer "sees" pressure at the catheter tip via a fluid-filled tubing system – treat the tubing like the stethoscope for your Swan/arterial line
- Level at the phlebostatic axis (4th intercostal space, mid-axillary line). Re-level with every position change
- Zero to air with stopcock off to patient before connecting or if numbers look wrong
- Square-wave (fast-flush) test: 1–3 oscillations and quick return to baseline = optimal damping. Too many oscillations = under-damped (overestimates SBP); no oscillation/slow = over-damped (underestimates SBP)
Arterial Line Quick Reminders
- Best for beat-to-beat BP and MAP; unreliable if waveform is poorly damped or catheter against vessel wall
- Never titrate pressors to a trash waveform – fix damping/leveling first
- Choose site with good collaterals (radial) when possible; check distal perfusion regularly
Central Venous Line (CVP)
- CVP is a pressure, not a volume – it represents the interaction of venous return, RV compliance, and intrathoracic pressure, not "fluid status" alone
- Normal CVP 2–6 mmHg; focus on trends and response to therapy rather than single values
- Waveform: a, c, v waves with x and y descents – loss of x (e.g., tamponade) or giant v waves (TR) give qualitative clues
- CVP is most useful as part of a bundle with PAOP, SVR, SvO₂, and echo, not in isolation
Pulmonary Artery (Swan-Ganz) Catheter – Anatomy & Waveforms
The PA catheter is a multi-lumen, balloon-tipped catheter "sailed" through the right heart into the pulmonary artery. Ports typically include a distal PA port (pressures/thermodilution), a proximal RA port (CVP, infusions), a thermistor near the tip (for CO), and sometimes a pacing lumen or continuous SvO₂ fiberoptic sensor.
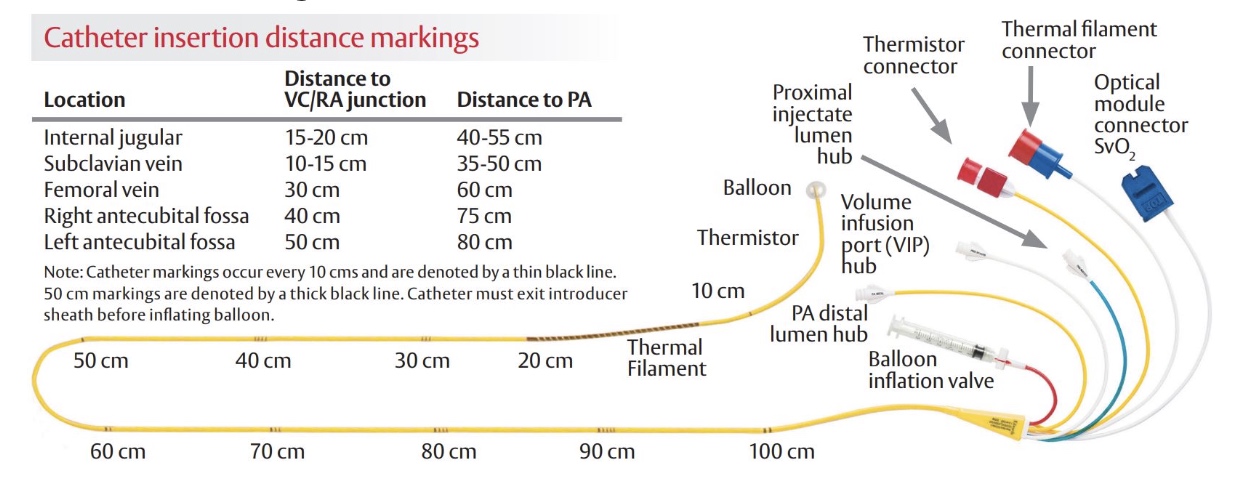
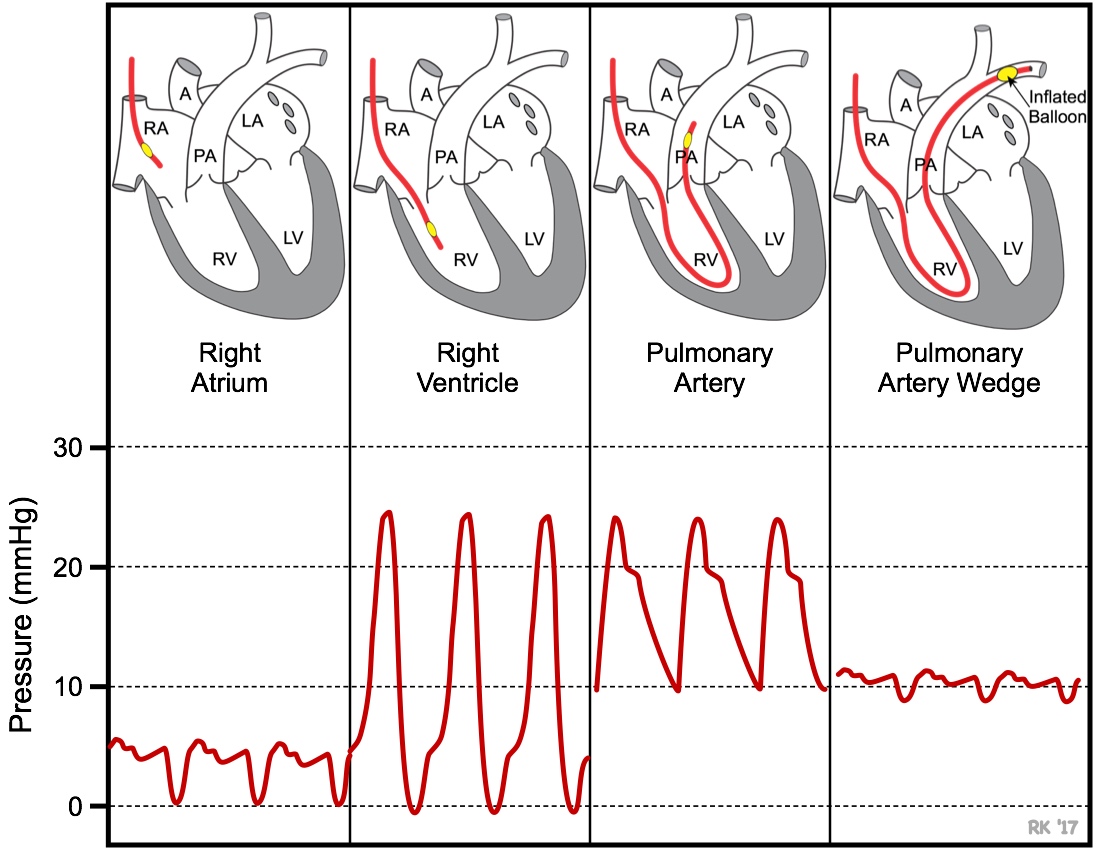
Typical Progression During Insertion
- Right atrium (RA/CVP): low pressure (2–6 mmHg), small undulating waveform
- Right ventricle (RV): large systolic upstroke (15–25 mmHg) with near-zero diastolic (~0–5 mmHg); no dicrotic notch
- Pulmonary artery (PA): systolic similar to RV (15–25 mmHg) but diastolic rises (8–15 mmHg); clear dicrotic notch from pulmonic valve closure
- Pulmonary artery occlusion pressure (PAOP/PAWP): balloon inflated; waveform becomes small and venous-looking with mean near 8–12 mmHg
| Location | Waveform look | Normal pressure range | Key identifiers |
|---|---|---|---|
| RA / CVP | Small amplitude venous waveform with a, c, v waves | 2–6 mmHg | No big systolic spikes; often slight respiratory variation |
| RV | Tall narrow systolic spikes (15–25) with diastolic near zero; no notch | 15–25 / 0–5 mmHg | Looks like slow VT; diastolic drops to baseline |
| PA | Systolic similar to RV; diastolic elevated; clear dicrotic notch | 15–25 / 8–15 mmHg (mPAP ~15) | Dicrotic notch on downslope; diastolic never near zero |
| PAOP | Low-amplitude venous waveform | 8–12 mmHg | Appears when balloon inflated; should disappear when balloon deflated |
PA Catheter Placement Demonstration
Getting Reliable Numbers: Technique Matters
- Measure at end-expiration: intrathoracic pressure is closest to zero; inspiratory swings (especially with high PEEP) otherwise distort PAOP/CVP
- Use the smallest balloon volume required to obtain a wedge waveform (never >1.5 mL). Over-wedging risks pulmonary artery rupture
- Limit wedge time to ≤15 seconds or ≤3 breaths; longer occlusion can cause ischemia
- Avoid wedging in hypoxic, coagulopathic, or severely elevated PA pressure patients unless the information will change management
- Confirm that wedge = PAOP: mean wedge should be slightly less than PA diastolic; if PAOP > PAD or varies markedly with ventilation, suspect artifact/over-wedge
Derived Variables & What They Tell You
Once waveforms and raw pressures look believable, calculate derived variables. These integrate multiple numbers into something clinically actionable.
| Variable | Formula (units consistent) | Normal | Why you care |
|---|---|---|---|
| Stroke volume (SV) | SV = CO / HR | ~60–100 mL/beat | Low SV with high filling pressures suggests pump failure; low SV with low filling suggests hypovolemia |
| Cardiac index (CI) | CI = CO / BSA | 2.5–4.0 L/min/m² | Key target in shock resuscitation; CI < 2.2 usually considered low-output |
| Systemic vascular resistance (SVR) | SVR = (MAP – CVP) / CO × 80 | 800–1200 dyn·s/cm⁵ | High SVR → clampy pipes (hypovolemic/cardiogenic); low SVR → distributive shock, vasoplegia, meds |
| Pulmonary vascular resistance (PVR) | PVR = (mPAP – PAOP) / CO × 80 | 50–250 dyn·s/cm⁵ | High PVR differentiates pure left-sided failure from primary pulmonary/RV pathology |
| Oxygen delivery (DO₂) | DO₂ ≈ CO × 1.34 × Hb × SaO₂ | ~900–1100 mL O₂/min | Low DO₂ from low CO, anemia, or hypoxemia – explains low SvO₂ and lactate rise |
| Oxygen consumption (VO₂) | VO₂ ≈ CO × (CaO₂ – CvO₂) | ~200–250 mL O₂/min | Helps separate failure of supply vs demand or extraction abnormalities in complex shock |
Shock Profiles Using Swan-Ganz Data
Patterns of CVP, PAOP, CI, and SVR are powerful for classifying shock and choosing therapy. Use them alongside echo, exam, and labs – not instead of them.
| Shock type | CVP | PAOP | CI | SVR | Primary fix (simplified) |
|---|---|---|---|---|---|
| Hypovolemic | Low | Low | Low/normal → low | High | Give volume first; vasopressors only as bridge if MAP critically low |
| Cardiogenic (LV failure) | High | High | Low | High | Inotropes ± vasopressors; afterload reduction if tolerated; cautious diuresis/ultrafiltration once perfusion restored |
| Obstructive – massive PE / high PVR | Normal/high | Normal/low | Low | High | Relieve obstruction (thrombolysis/embolectomy); support RV with pressors/inotropes; avoid excessive fluids |
| Obstructive – tamponade | High CVP with equalized diastolic pressures | High/near CVP | Low | High | Drain pericardium; small fluid boluses as bridge; avoid vasodilators |
| Distributive – early sepsis | Low/normal | Low/normal | High or normal | Low | Source control; aggressive fluids then vasopressors; consider inodilators only if cardiac dysfunction emerges |
| Distributive – late sepsis | Variable; often high | Variable; may be high from capillary leak | Low | Low/normal | Vasopressors ± vasopressin; inotropes if low CI; conservative fluids |
| Neurogenic | Low/normal | Low/normal | Low/normal | Low | Vasopressors to restore SVR; judicious fluid – don't overfill a compliant venous system |
Common Pitfalls & Complications
Technical Pitfalls
- Over-wedging: wedge waveform persists with balloon deflated or PAOP > PAD – pull back slightly and re-check. Prolonged or forceful wedging risks pulmonary artery rupture (hemoptysis, shock)
- PAOP ≠ LVEDP: in mitral stenosis/regurgitation, pulmonary venous obstruction, non-compliant LV (hypertrophy, ischemia), high PEEP, or severe ARDS – wedge may overestimate LVEDP
- Respiratory swings: large positive-pressure breaths and high PEEP can transiently elevate CVP and PAOP; always average/measure at end-expiration
- Catheter whip: excessive motion in RV gives noisy, spiky waveforms; small position changes or patient repositioning may help
Complications During Insertion
- Arrhythmias: irritability in RV can trigger VT/VF or new bundle branch block; balloon inflation and rapid advancement into PA typically reduce irritation – but be ready to treat
- Knotting of catheter
- Valvular damage
- Cardiac perforation
Complications During Use
- Infection and thrombosis: PA catheters share all central line risks – strict aseptic handling, minimize duration, and never leave the catheter static without continuous flush
- Pulmonary artery rupture (especially with over-wedging or anticoagulation)
- Pulmonary infarction
- Endocarditis
- Catheter-related sepsis
Rapid Interpretation Script When You Get a Swan Printout
- Trust the hardware first: confirm transducer level/zero, good waveforms, and correct phase of respiration
- Look at the pump: CO/CI, SV, and SvO₂ – is cardiac output adequate for demand?
- Look at preload: CVP and PAOP – are the chambers full, empty, or overfilled? Remember that "full and failing" (high PAOP, low CI) is different from "empty and failing" (low PAOP, low CI)
- Look at the pipes: calculate SVR (and PVR if available) – are we dealing with vasodilation or vasoconstriction?
- Integrate with clinical context: lactate, UOP, extremity temperature, mental status, and bedside echo
- Decide on direction: primarily fluid (empty), primarily pressor (vasodilated), primarily inotrope/mechanical support (pump failure), or some combination
- Reassess after every meaningful change – the value of a Swan is in trending, not one-off numbers
References
- IA MED. (2018). Hemodynamic monitoring and mechanical ventilation review. IA MED.
- IA MED. (2018). Shock summary. IA MED.
- FOAMfrat. (2020). Crossing the line: From peripheral to central venous access. FOAMfrat.
- Nickson, C. (2024). CVP measurement. Life in the Fast Lane.
- Nickson, C. (2024). Cardiac output measurement. Life in the Fast Lane.
- Nickson, C., & Cadogan, M. (2019). Pulmonary artery catheter. Life in the Fast Lane.
- Nickson, C. (2007). Haemodynamic monitoring [PDF]. Life in the Fast Lane.
- Yartsev, A. (2015–2025). Haemodynamic monitoring series. Deranged Physiology.
- Nair, R., & Nair, P. (2023). Pulmonary capillary wedge pressure. In StatPearls. StatPearls Publishing.